
From Reacting to Reading the Auction: How One Gold Trader Built a More Repeatable Trading Process with Bookmap
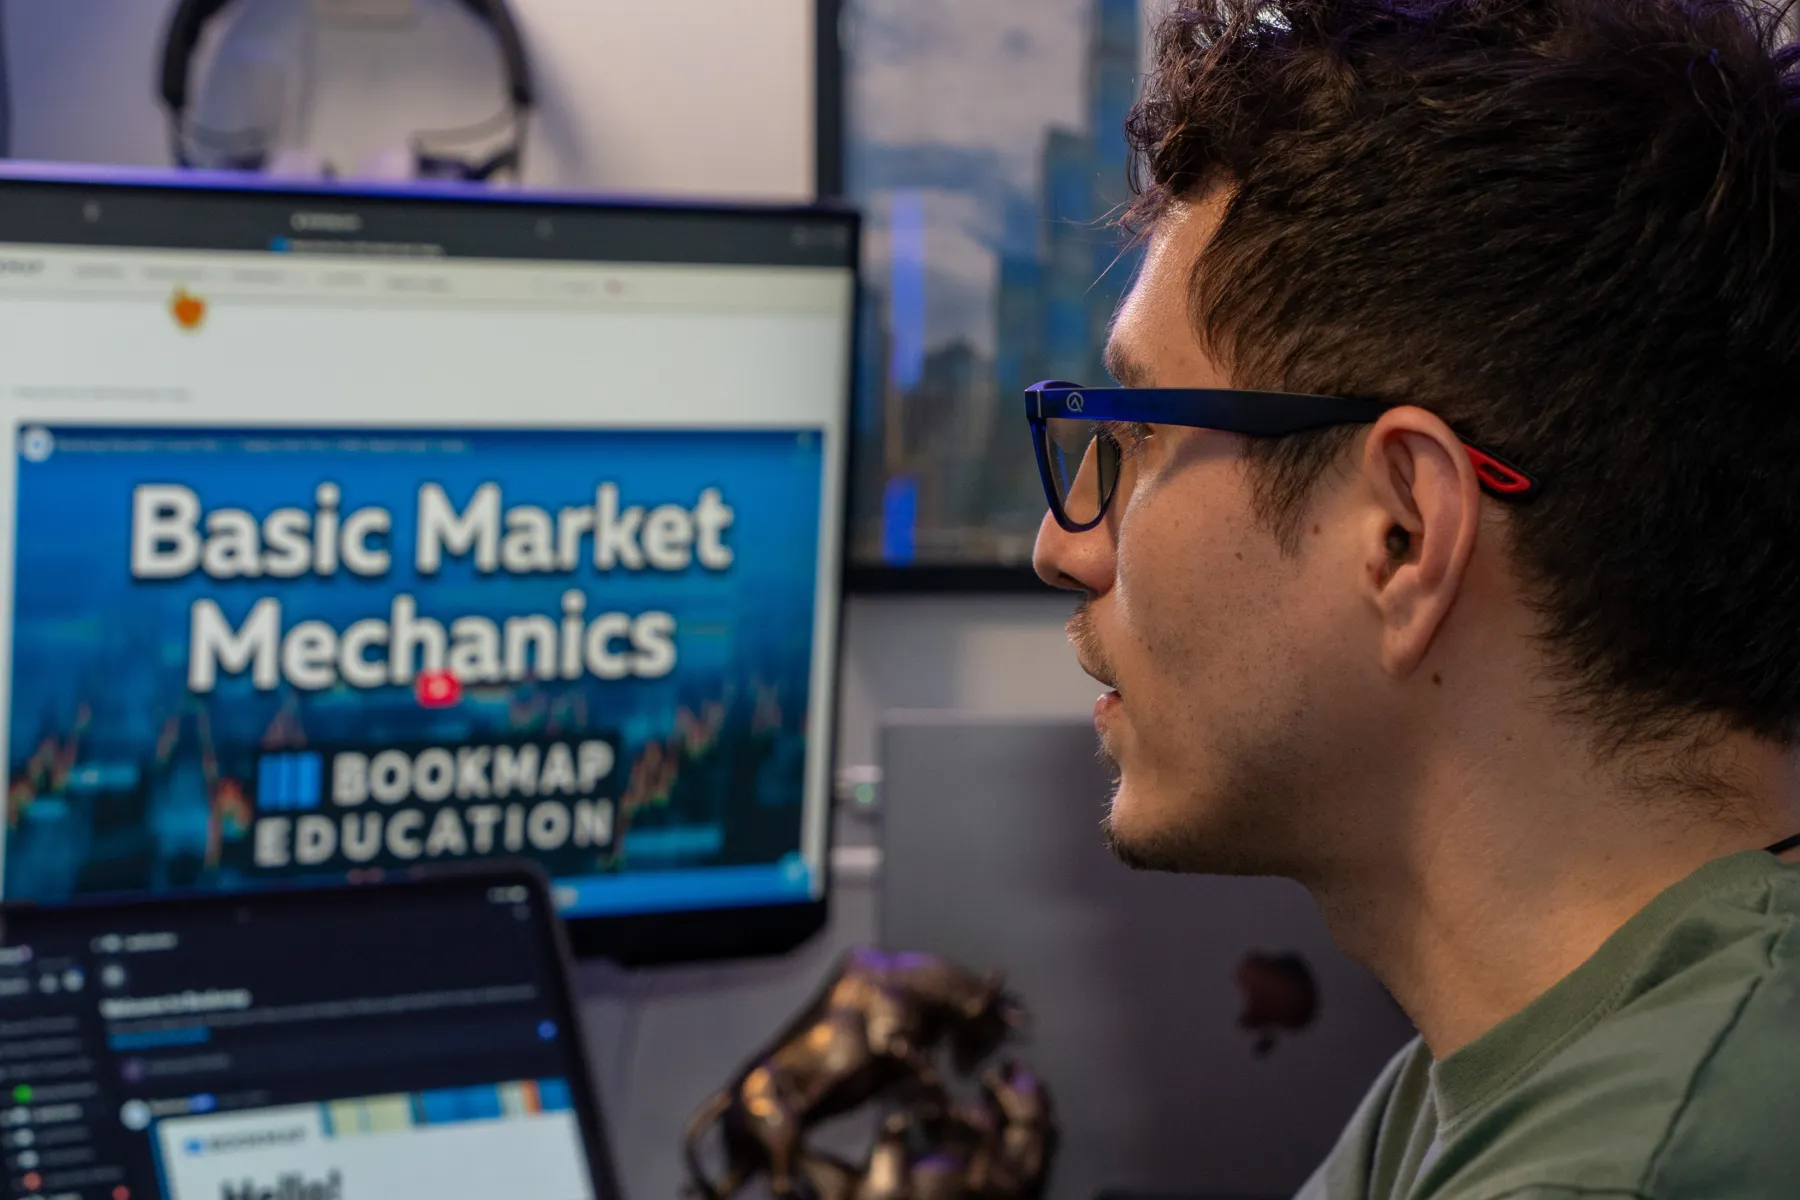
Table of Contents
- Introduction: Looking Beyond the Candlestick
- Trading Gold with a Structured Process
- Searching for Better Confirmation
- Learning to Read the Auction with Bookmap
- The Biggest Lesson: Liquidity Isn’t the Trade
- Building a Repeatable Trading Workflow
- Trade Breakdown: A Gold Reversal at Overhead Liquidity
- Reviewing Trades and Refining the Process
- Advice for Traders Learning Order Flow
- Conclusion: Trade the Response, Not the Level
“Bookmap helped me move from reacting to candle outcomes toward observing the auction in real time—making trade selection, timing, and risk decisions more repeatable.” – Xeno (Bookmap Trader)
For many traders, identifying an important price level isn’t the difficult part. The real challenge begins once price actually reaches it.
Support and resistance levels, trendlines, moving averages, and candlestick patterns can all help build a trading plan before the session starts. They provide structure, context, and potential scenarios. But when the market is moving in real time, those same levels often leave traders asking the same question: what is actually happening here?
Two setups can appear nearly identical on a candlestick chart yet produce completely different outcomes. One breakout continues into a strong trend, while another fails within seconds. One support level attracts buyers and launches a reversal, while another breaks with little resistance. Looking only at completed candles explains where price went, but it rarely reveals the interaction that caused the move.
For one Bookmap user, answering that question became the missing piece of his trading process.
An experienced intraday trader focused primarily on gold, Xeno already had a structured approach to the markets. Every trading day began with preparation. He reviewed higher-timeframe market structure, identified significant price levels, mapped out continuation and reversal scenarios, and defined his risk before the opening bell. Like many professional traders, he wasn’t looking for random opportunities throughout the day. He entered each session with a plan and waited for the market to come to him.
Yet despite having a disciplined process, he found himself facing a familiar frustration. His market analysis was often correct, but his execution wasn’t always as consistent as he’d like.
Sometimes he entered too early, anticipating a move before buyers or sellers had truly taken control. Other times he hesitated because he couldn’t confidently distinguish between a genuine breakout and one that was likely to fail. Occasionally, he’d be stopped out only to watch the market move exactly as he’d expected minutes later.
The issue wasn’t predicting direction.
It was knowing when the conditions actually supported taking the trade.
Looking back, he realized that traditional charting tools were giving him a clear picture of market structure but only a limited view of the auction taking place beneath it.
Candlestick charts showed the outcome of trading activity after it had already happened. Volume indicators measured participation. Price action revealed where the market had been. Together, those tools formed an essential foundation for analysis, but they couldn’t fully answer the questions that mattered most in the moment.
Was the liquidity resting above the market genuine, or would it disappear as price approached?
Were aggressive buyers actually gaining control, or were they repeatedly running into passive sellers absorbing every attempt to move higher?
Had control genuinely shifted from one side of the market to the other, or was price simply reacting temporarily before continuing in the original direction?
Those questions became increasingly important because they directly affected the quality of his execution. A technically sound trading idea could still become a losing trade if it was entered too early. Likewise, waiting for objective confirmation could often mean avoiding a false breakout altogether.
Instead of searching for another indicator or another strategy, he started searching for something different: a way to observe the market auction itself.
He wanted to see not only where price was trading, but how participants behaved as price interacted with important levels. He wanted to understand where liquidity was resting, whether it remained in place or was pulled away, where aggressive buying and selling occurred, and—perhaps most importantly—whether the market actually responded to that activity.
That search eventually led him to Bookmap.
Initially, his expectations were straightforward. He was looking for better visibility into liquidity and order flow, hoping it would provide additional confirmation for the ideas he was already developing from market structure. What he discovered, however, was something more fundamental.
Rather than changing what he traded, Bookmap gradually changed how he interpreted the market.
Instead of treating liquidity as static support or resistance, he began viewing it as part of a constantly evolving auction. Rather than assuming a large liquidity level would automatically stop price, he learned to watch what happened when that level was tested. Did the liquidity remain? Did it refresh as orders traded against it? Did aggressive buyers produce meaningful price progress, or was their effort absorbed without achieving the expected result?
Those observations became far more valuable than the liquidity itself.
As his understanding of order flow developed, so did his trading philosophy. The objective was no longer to predict every market move. It was to build a repeatable process for evaluating whether a trading idea was being confirmed—or invalidated—in real time.
That shift fundamentally changed the way he approached every trade.
Building a Process Instead of Chasing Setups
Like many experienced traders, his development didn’t come from finding a single “aha” moment or discovering a new setup that suddenly transformed his results. It came from refining the decision-making process that happened between identifying an opportunity and pressing the buy or sell button.
Before using Bookmap, Xeno relied primarily on conventional charts, price structure, and standard volume analysis to build trade ideas. Those tools remained an important part of his workflow, and they still do today. Market structure provides context. Higher timeframes establish the broader narrative. Risk management determines position size and defines acceptable loss before the trade even begins.
Bookmap didn’t replace any of those components.
Instead, it became the layer between the trading idea and the execution decision.
If market structure suggested buyers should defend a level, Bookmap helped answer whether they actually were.
If a breakout looked promising on a candlestick chart, Bookmap helped determine whether the buying pressure was producing meaningful progress—or simply expending effort without gaining control.
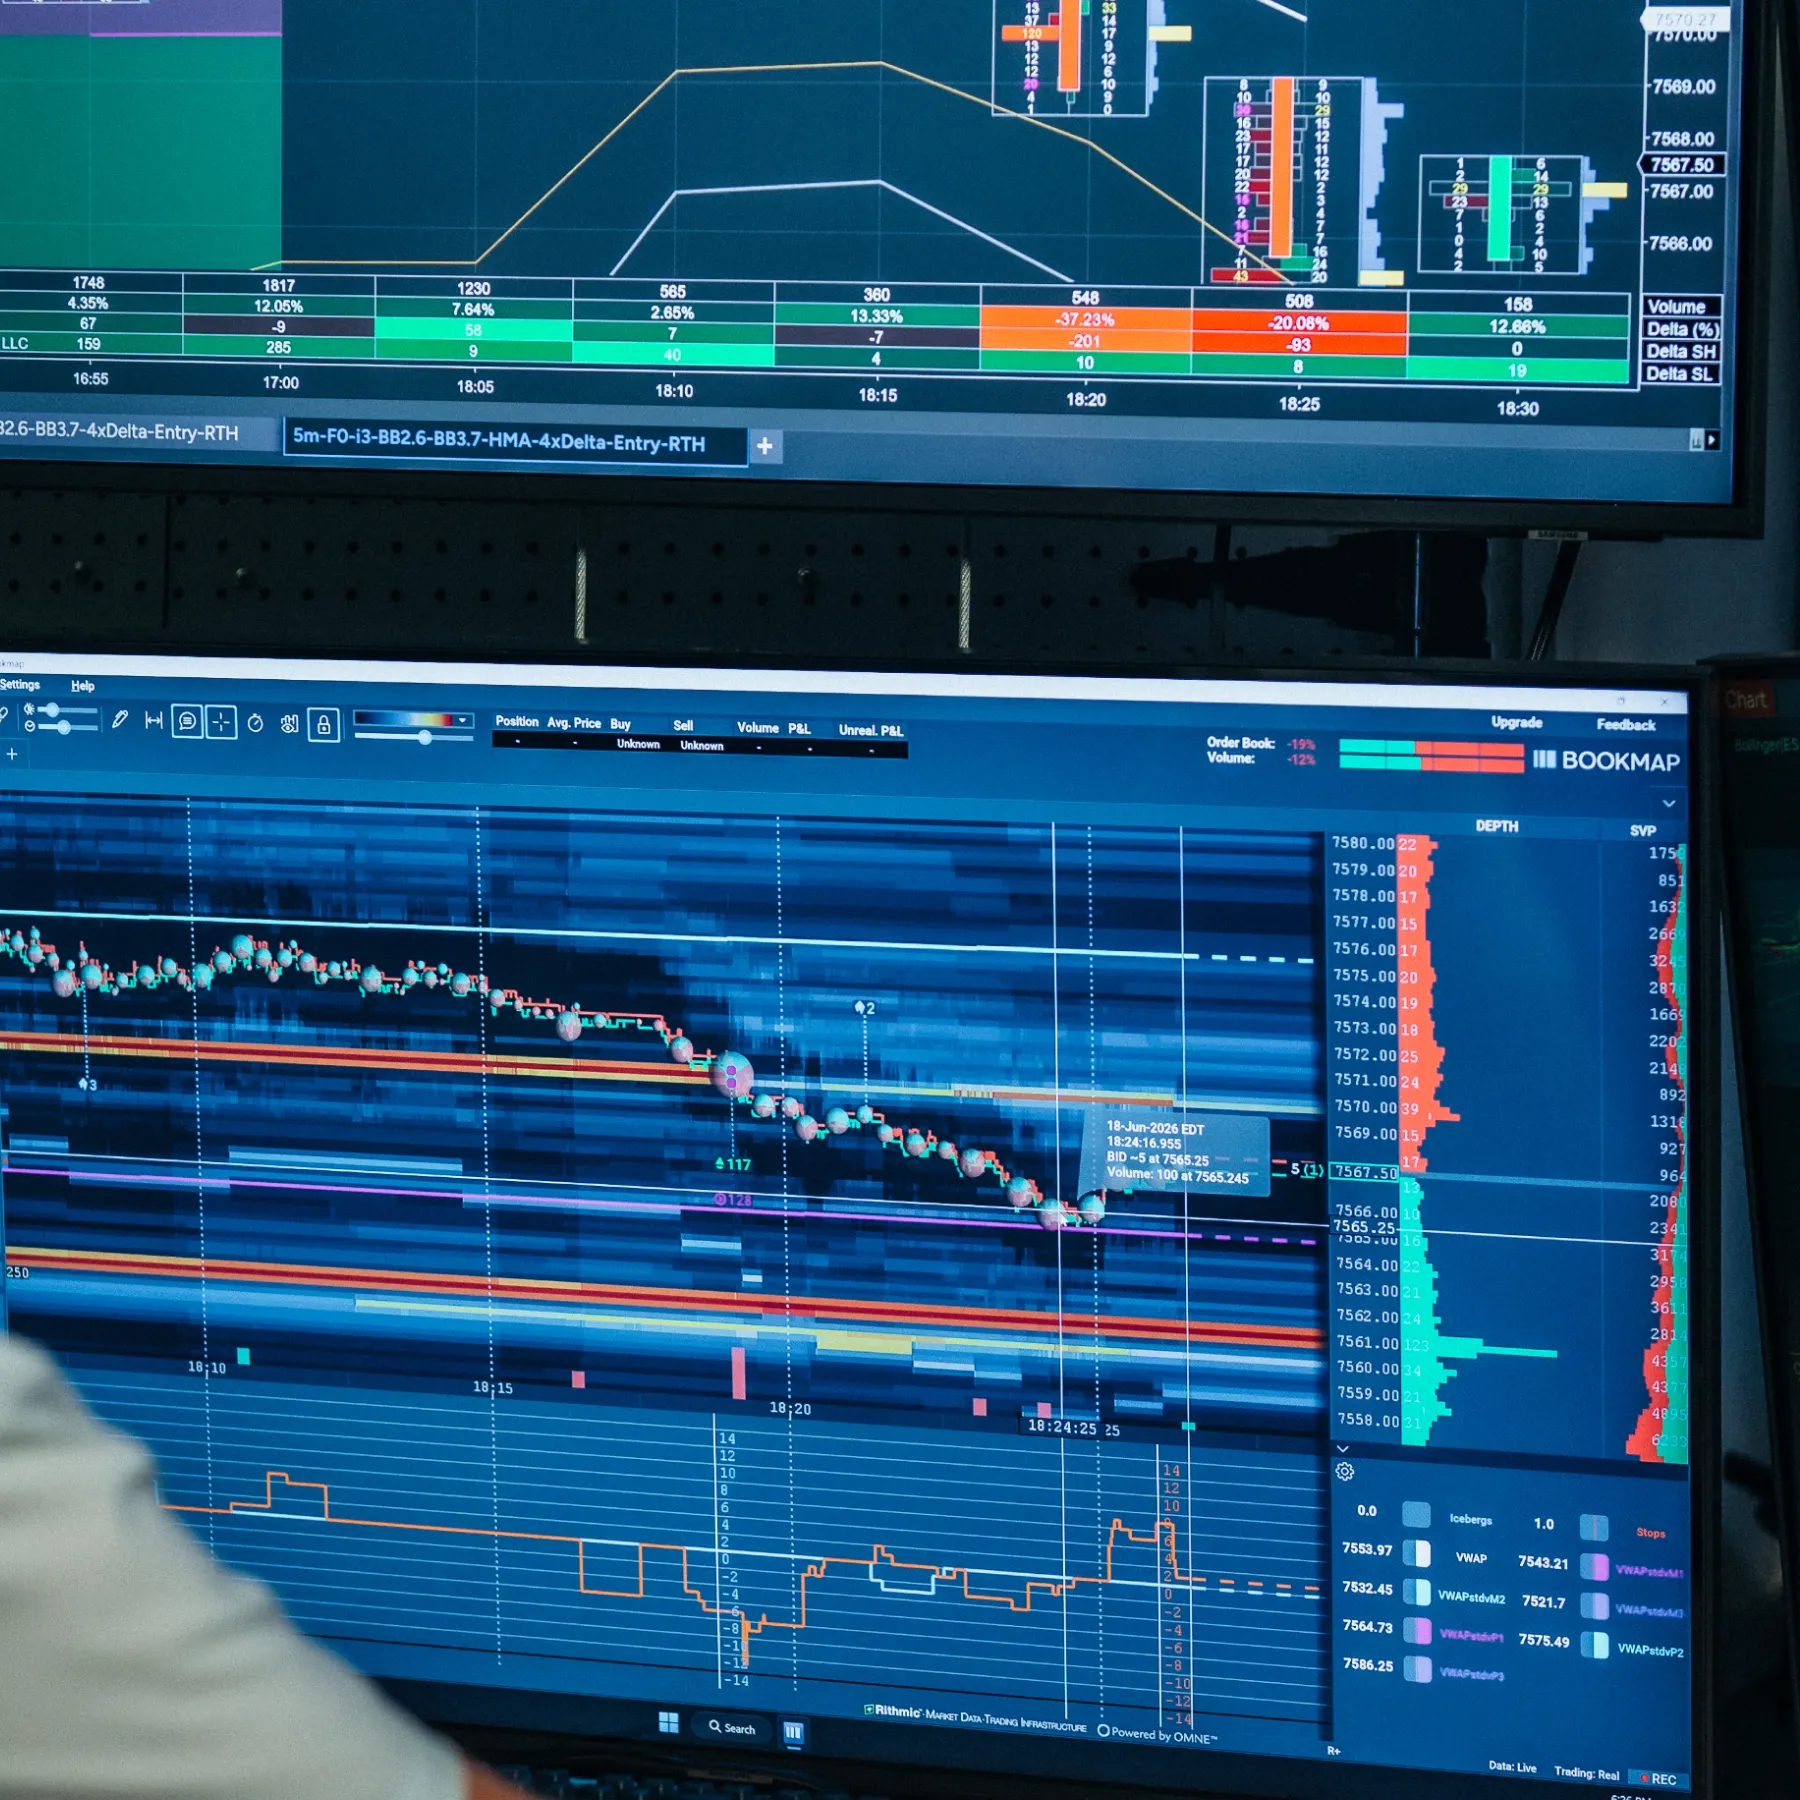
Rather than reacting to completed candles, he began observing the sequence of events unfolding inside the auction itself. Liquidity, executed volume, absorption, replenishment, and price response all became pieces of the same story. Instead of asking, “Is this resistance?” the question became, “How is the market behaving now that we’ve reached this area?”
That subtle change in perspective would eventually become one of the most valuable lessons he learned—not only about Bookmap, but about trading itself.
Learning to Read the Auction
Like many traders who first open Bookmap, his initial reaction wasn’t immediate clarity.
It was information overload.
The heatmap was unlike anything he had used before. Bright bands of liquidity appeared across the screen, executed volume bubbles were constantly updating, and every movement seemed to contain more information than a traditional chart could display in an entire session. At first, the temptation was to assume that every large liquidity level represented an important support or resistance zone, and that every significant volume bubble deserved attention.
It didn’t take long to realize that this approach wasn’t sustainable.
“The heatmap is visually powerful,” he explains, “and it’s easy to assume every bright band matters. The key lesson was that the snapshot is less important than the behavior over time.”
That realization became one of the defining moments in his learning process.
Instead of looking for static levels, he began observing relationships. How did liquidity behave as price approached? Did large orders remain in place, or were they pulled moments before the market reached them? When aggressive buyers hit a liquidity level, did price continue moving higher, or did it stall despite significant buying activity? Those questions gradually replaced the habit of simply identifying bright areas on the heatmap.
This represented a subtle but important shift in thinking. Rather than treating Bookmap as a tool for finding levels, he started using it to understand behavior.
The Biggest Misconception About Liquidity
One of the most valuable lessons he learned was that displayed liquidity should never be interpreted as a prediction.
Many traders naturally assume that a large order resting above the market must act as resistance, while a large bid below the market should provide support. Sometimes that happens. Other times, those same orders disappear before price ever reaches them, or they are absorbed without producing the reaction traders expect.
“The biggest misconception,” he says, “was believing that a large liquidity wall automatically acts as support, resistance or a magnet.”
Displayed liquidity represents intent—but intent can change.
Large participants may add liquidity, pull it away, replenish it as orders execute, or simply allow it to be consumed. The order itself isn’t the story. The story begins when the market interacts with it.
Imagine price rallying into a significant offer that has been visible for several minutes. On a traditional chart, traders simply see price approaching resistance. On Bookmap, however, several different scenarios may unfold.
The liquidity may remain in place while aggressive buying repeatedly trades against it without producing meaningful upward progress. That behavior can suggest absorption, where sellers continue accepting incoming buy orders while preventing price from advancing.
In another scenario, the liquidity may disappear entirely moments before price reaches it, allowing the market to continue higher with relatively little resistance.
Alternatively, the resting orders may refresh continuously, maintaining a strong defensive presence while price struggles to break through.
Each outcome tells a different story.
The important information isn’t that liquidity existed. It’s how the market responded once that liquidity was tested.
That idea fundamentally changed how he interpreted order flow.
Instead of asking, “Is this resistance?”, he began asking, “What is resistance actually doing?”
From Reading Levels to Reading Responses
Looking back, he describes this as the point where Bookmap truly started to make sense.
Before, his attention naturally focused on the size of a liquidity level. Large orders appeared significant simply because they were large.
Over time, he realized that size alone rarely provided enough information to make a trading decision.
What mattered was the sequence of events that followed.
Did aggressive buyers produce immediate price acceptance above the level?
Did sellers absorb repeated buying attempts without giving up ground?
Did buyers continue committing capital while price barely moved?
Or did the market quickly reject the entire area and rotate in the opposite direction?
These questions shifted his attention away from predicting outcomes and toward observing evidence.
He summarizes the change simply: the question stopped being, “How large is that level?” and became, “What happens when the market tests it?”
That distinction sounds small, but it fundamentally changes how a trader interprets order flow.
Rather than assuming a level should hold because it looks important, the trader waits for the market to demonstrate whether buyers or sellers are actually maintaining control.
In many cases, that means doing nothing.
One of the less obvious benefits of this approach is that it encourages patience. Instead of feeling pressure to trade every interaction with liquidity, he learned to let the auction reveal more information before committing capital. Sometimes that confirmation arrived within seconds. Other times, the absence of confirmation became the signal to stay out of the trade altogether.
For him, avoiding a low-quality trade became just as valuable as finding a high-quality one.
Building Confidence One Feature at a Time

Although the heatmap initially drew his attention, it wasn’t the only feature that shaped his workflow.
The first breakthrough came from combining the liquidity heatmap with executed volume bubbles. Seeing where liquidity was resting and then watching aggressive buying or selling interact with those areas made concepts such as absorption and failed breakouts much easier to recognize in real time.
Once that foundation was in place, other tools began fitting naturally into the process.
Cumulative Volume Delta (CVD) provided additional context around buying and selling pressure. Rather than treating it as a standalone signal, he used it to support the broader story unfolding on the heatmap. Iceberg information offered another perspective on hidden participation, particularly when large traders continued refreshing orders at important locations.
Perhaps the most valuable feature, however, was Replay.
Live markets move quickly. Important interactions can be easy to miss, especially while managing an open position. Replay made it possible to slow everything down, revisit key decisions, and study the same auction repeatedly without the pressure of live trading.
Instead of asking whether a trade made money, he could examine whether the decision itself was based on sound evidence. Did price respond the way he expected? Was the liquidity behaving consistently with his original thesis? Had he entered too early, or ignored signs that control was shifting?
Those reviews gradually turned isolated experiences into repeatable observations.
The goal wasn’t to memorize patterns.
It was to understand the behavior that created them.
From Observation to Execution
As these pieces came together, his relationship with Bookmap also changed.
He no longer opened the platform looking for trade signals.
Instead, Bookmap became the final layer of confirmation between having an idea and committing capital.
Market structure still generated the hypothesis.
Risk management still determined position size and predefined exits.
Bookmap answered a different question entirely:
Is the market currently behaving in a way that supports this idea?
If the answer was yes, execution became much easier.
If the answer was no, there was no trade—regardless of how attractive the chart looked.
That shift didn’t eliminate losing trades, nor did it remove uncertainty from the markets. What it did provide was a more objective framework for making decisions. Rather than relying on intuition alone, he could evaluate whether the auction itself was confirming or contradicting his original thesis.
And that would become especially important during one particular gold trade, where a seemingly bullish breakout evolved into a textbook example of why price response matters more than price movement alone.
Putting the Process into Practice: A Gold Trade That Never Became a Breakout
Every trading methodology eventually comes down to a single question:
What do you do when the market reaches the level you’ve been waiting for?
Preparation, analysis, and risk management all happen before the trade begins. But execution happens in real time, when information is incomplete and decisions have to be made quickly. This is where many traders struggle. It’s easy to explain a trade after the fact. It’s much harder to recognize the difference between a genuine opportunity and a trap while the market is still unfolding.
One recent gold trade illustrates exactly how this trader uses Bookmap to bridge that gap.
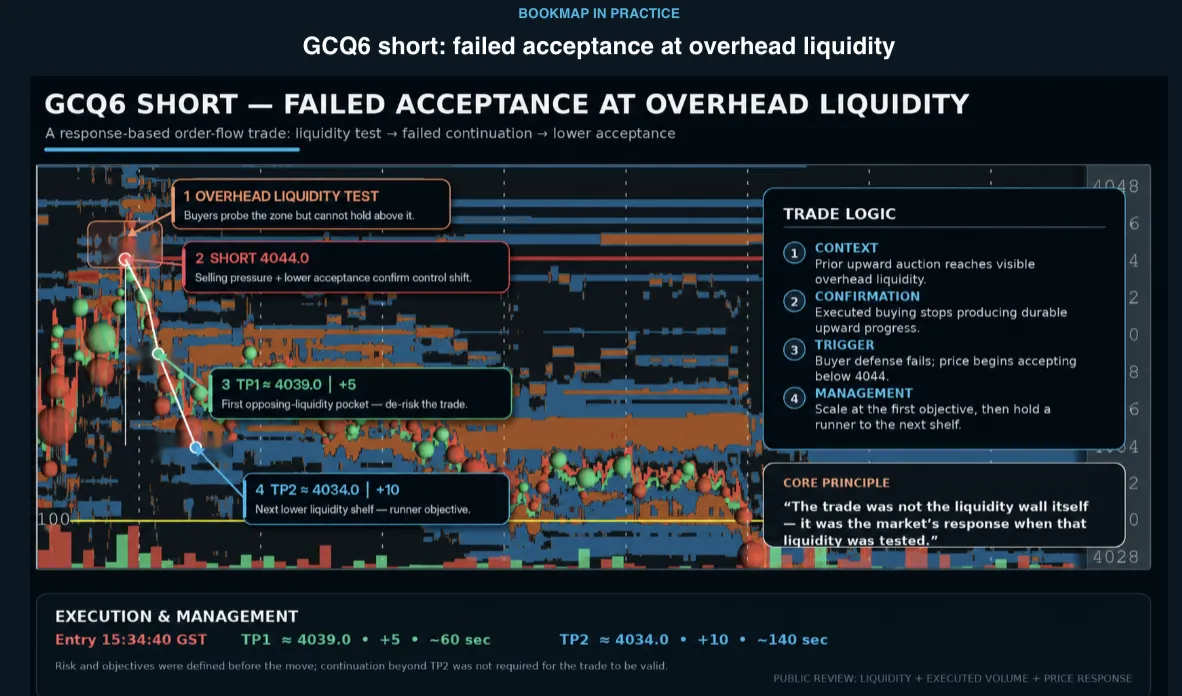
The setup developed as price rallied toward a well-defined area of overhead liquidity around 4044. On a traditional chart, there was very little to discourage buyers. Momentum was positive, price was pressing into resistance, and many traders would naturally interpret the move as the beginning of a breakout. If all you could see were candlesticks, buying the breakout would have seemed like a perfectly reasonable decision.
But this trader wasn’t interested in what the chart suggested should happen.
He wanted to know what the auction was actually saying.
As price approached the overhead liquidity, buying activity increased exactly as expected. Market orders aggressively lifted offers, and the executed volume bubbles reflected strong participation from buyers. At first glance, the activity appeared bullish. Buyers were clearly willing to commit capital in an attempt to push the market higher.
The next question, however, was far more important.
Was that buying producing results?
Instead of immediately chasing the move, he watched the relationship between aggressive buying, resting liquidity, and price response.
What happened next changed the entire trade.
Although buyers continued attacking the overhead liquidity, price failed to make meaningful progress above it. The offers resting in the area remained active. Buying pressure was certainly present, but the market wasn’t behaving as though buyers had actually gained control. The effort being invested wasn’t producing the expected reward.
This is one of the concepts that experienced order flow traders often describe as effort versus result.
Markets constantly consume energy. Buyers become aggressive. Sellers defend positions. Orders trade continuously. But activity alone doesn’t determine direction. What matters is whether that activity successfully moves the market.
In this case, the answer appeared to be no.
Repeated buying attempts failed to establish acceptance above the liquidity. Instead of accelerating higher, price began slowing. The auction wasn’t confirming the breakout thesis—it was questioning it.
That distinction mattered.
Many traders are conditioned to focus primarily on participation. More buying often feels synonymous with a stronger market. Yet order flow frequently tells a more nuanced story. Heavy buying that fails to move price can be just as informative as heavy selling that fails to push the market lower. In both cases, one side is committing significant effort while the opposing side quietly absorbs that pressure.
Rather than interpreting buying activity as an automatic invitation to join the move, the trader treated it as information to evaluate.
If buyers were genuinely taking control, price should have accepted above the level and continued higher.
It didn’t.
At the same time, another subtle shift began developing.
Support underneath the move started weakening.
The aggressive buying that had driven the rally no longer appeared capable of producing fresh highs, while the defending liquidity above continued doing its job. Instead of seeing evidence that strengthened the original bullish case, the trader saw evidence that gradually weakened it.
Importantly, he still didn’t enter the trade.
This is perhaps one of the biggest differences between reactive trading and process-driven trading.
Many traders would already have made two decisions by this point. They either would have bought the breakout because of the bullish momentum, or they would have aggressively faded it because resistance looked strong.
He did neither.
Instead, he continued waiting for confirmation.
Only when price began accepting back below the tested area did the market provide the evidence he was looking for. At that moment, the story changed. Buyers had tested overhead liquidity multiple times without establishing control. The attempted breakout had failed. The auction was now beginning to rotate lower.
Only then did he initiate the short position.
Notice what didn’t trigger the trade.
It wasn’t simply the presence of a large liquidity wall.
It wasn’t a bearish candlestick pattern.
It wasn’t an indicator crossing below a moving average.
The trade was triggered by a sequence of observations that all supported the same conclusion. Buyers had invested significant effort without achieving meaningful progress. Liquidity remained active. Price failed to establish acceptance above the area. Once the market confirmed acceptance back below that level, the probability of a reversal improved considerably.
Execution, however, was only one part of the process.
Trade management followed the same disciplined approach.
Rather than attempting to capture the entire move in a single position, he managed risk in stages. As price reached the first opposing liquidity pocket around 4039, part of the position was taken off. This accomplished two things. It locked in realized profit while simultaneously reducing overall exposure. With risk reduced, the remaining portion of the trade could be managed more objectively toward the next liquidity shelf near 4034, where additional buyers might reasonably be expected to appear.
Everything about the trade reflected the same philosophy.
Preparation created the opportunity.
Observation supplied the evidence.
Execution followed confirmation.
Risk management remained predefined from beginning to end.
Looking back afterward, the trader believes the most important lesson had very little to do with the profit itself.
“The trade was not the liquidity wall,” he explains. “The trade was the market’s response when that liquidity was tested.”
That single sentence captures one of the central ideas behind modern order flow analysis.
Liquidity isn’t a signal.
It’s context.
Executed volume isn’t a signal.
It’s context.
Even price movement, by itself, rarely tells the complete story.
The edge comes from understanding how those pieces interact.
Does aggressive participation produce acceptance?
Does the defending side absorb the pressure?
Is the auction progressing naturally, or is one side spending increasing effort while achieving diminishing results?
By asking those questions before entering the trade, the trader transformed what could have been an emotional decision into a structured evaluation. Instead of reacting to what appeared to be a bullish breakout, he waited for the market to reveal whether buyers had actually earned control.
On that day, they hadn’t.
And because he allowed the auction—not the chart alone—to guide his decision, the higher-probability opportunity turned out to be trading the reversal rather than chasing the breakout.
Building Better Habits, Not Just Better Trades
Like many traders, he initially judged success by outcomes.
A winning trade felt like confirmation that the process had been correct. A losing trade often triggered a search for what had gone wrong. Over time, however, one of the biggest changes in his routine had little to do with individual trades and everything to do with how he evaluated his own decisions.
Replay became a central part of that process.
Instead of reviewing only profitable trades, he began revisiting every type of market interaction: winners, losers, missed opportunities, and even the trades he consciously chose not to take. Each review became an opportunity to compare what he believed was happening in real time with what the auction was actually revealing.
“I save examples of winners, losers and trades I correctly avoided,” he explains. “I compare similar-looking situations to understand what was different at decision time.”
Those reviews helped him separate something many traders unintentionally combine: decision quality and trade outcome.
A well-executed trade can still lose money. Markets are uncertain, and no setup works every time. Likewise, a poorly planned trade can occasionally produce a profit simply because the market moved in the trader’s favor.
Judging decisions solely by profit and loss can make it difficult to identify genuine improvements. By replaying sessions and studying the auction without the pressure of live execution, he could evaluate whether his reasoning had been sound regardless of the final result.
Did the market actually confirm the thesis before entry?
Was there evidence that buyers or sellers had taken control?
Did he wait for acceptance, or did he anticipate it?
Were there warning signs that he ignored?
Those became far more valuable questions than simply asking whether the trade made money.
Over time, this review process reinforced another important habit: patience.
Rather than feeling compelled to participate every time price reached an interesting level, he became increasingly comfortable waiting for confirmation—or choosing not to trade at all. In many sessions, doing nothing became a perfectly valid outcome. If the auction failed to provide objective evidence supporting his original idea, there was no reason to force an entry.
That change had a noticeable impact on his consistency.
“The most meaningful improvement has been trade selection,” he says. “I take fewer trades simply because a level looks attractive, and I have clearer reasons for entering, waiting or doing nothing.”
Fewer trades didn’t mean fewer opportunities.
It meant fewer unnecessary trades.
By allowing the market to confirm or invalidate his thesis before committing capital, he reduced avoidable losses while increasing confidence in the trades he did take.
Integrating Bookmap Into a Broader Trading Process
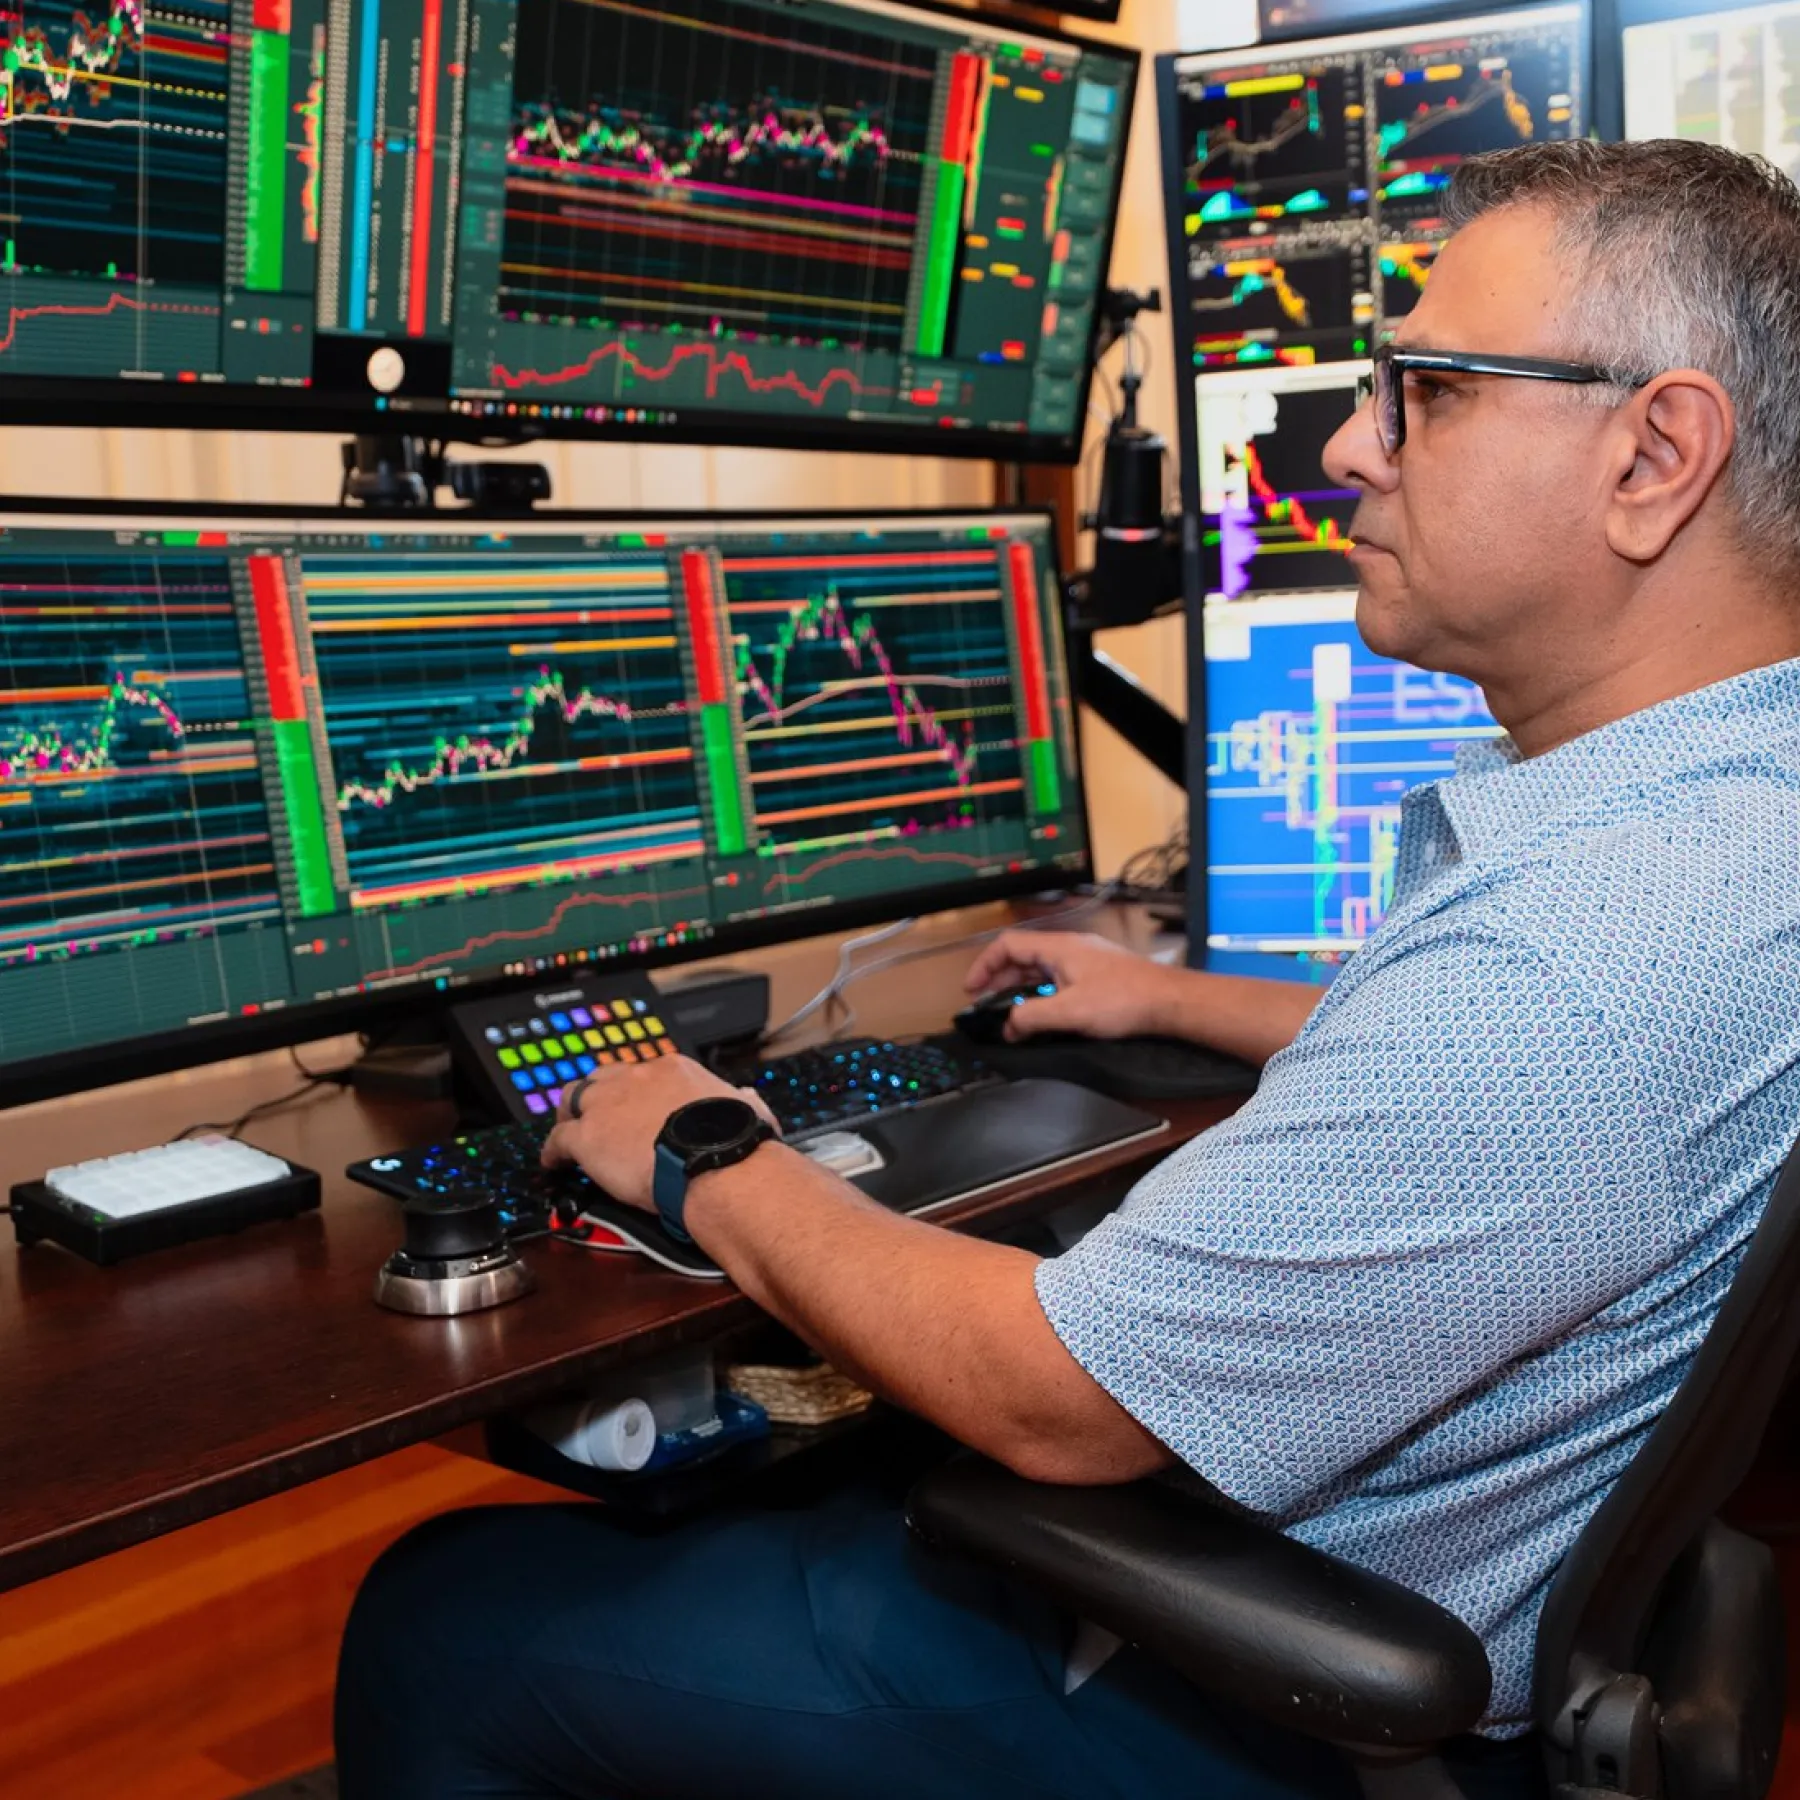
One of the most interesting aspects of his workflow is that Bookmap never became a replacement for everything else.
He still relies on conventional charts to understand the broader market structure. Higher timeframes help identify important support and resistance zones, session context, and the larger narrative driving price action. His execution platform continues to manage orders and positions, while predefined risk parameters determine position size, maximum exposure, and exit logic before a trade is even considered.
Bookmap sits between those pieces.
Market structure generates the hypothesis.
Risk management defines the boundaries.
Bookmap provides the evidence needed to decide whether the market is actually behaving in a way that supports the idea.
That distinction is important because it highlights what order flow analysis is—and what it isn’t.
It isn’t a standalone trading system.
It doesn’t eliminate uncertainty.
It doesn’t predict the future.
Instead, it provides additional context for evaluating what is happening in the auction right now.
For this trader, that context has become the final checkpoint before execution.
Advice for Traders Learning Order Flow
When asked what advice he would give someone opening Bookmap for the first time, his answer isn’t to learn every feature as quickly as possible.
In fact, it’s almost the opposite.
Start simple.
Choose one instrument and follow it consistently. Observe how liquidity behaves during the same trading session each day. Keep the workspace clean rather than filling it with every available indicator. Most importantly, focus on understanding behavior before trying to interpret every piece of information on the screen.
That advice reflects the same learning process he experienced himself.
Early on, it’s easy to become fascinated by the visual complexity of the heatmap or assume that every large liquidity level represents an opportunity. But genuine understanding comes from repetition. Watching hundreds of similar interactions gradually reveals the subtle differences between successful breakouts, failed auctions, absorption, and genuine shifts in control.
Replay accelerates that learning.
Screenshots help document it.
Trading journals reinforce it.
Over time, those observations become pattern recognition—not because the trader memorizes setups, but because he begins recognizing the behavior that consistently precedes them.
Perhaps the most important lesson, however, is to resist searching for certainty.
Order flow doesn’t remove uncertainty from trading.
No tool can.
What it can do is help traders ask better questions.
Instead of assuming a level will hold, ask how participants behave when that level is tested.
Instead of chasing aggressive buying, ask whether that buying is actually producing upward progress.
Instead of reacting to price movement alone, observe whether the market is accepting new prices or rejecting them.
Those questions shift the focus away from prediction and toward observation—a subtle change that often leads to better decisions.
Conclusion
Every trader eventually develops a process that reflects how they understand the market.
Some rely primarily on technical indicators. Others build their decisions around macroeconomic events, statistical models, or discretionary price action. For this trader, the missing piece wasn’t another way to predict where price might go next. It was a better way to understand what the market was communicating while the auction was still unfolding.
Bookmap became the bridge between preparation and execution.
Market structure still defines where opportunities may exist. Risk management still determines how much capital is placed at risk. Those principles haven’t changed.
What changed was the quality of the information available when it mattered most.
Instead of reacting to completed candles, he began observing the interaction that created them. Liquidity became something to evaluate rather than blindly trust. Executed volume became meaningful only when viewed alongside price response. Every trade evolved into a sequence of questions that either strengthened or weakened the original hypothesis.
Looking back, the biggest improvement wasn’t finding more trades.
It was developing greater confidence in which trades deserved to be taken.
As he puts it, Bookmap didn’t remove uncertainty or replace discipline. What it changed was his ability to observe, test, and explain his own decisions. Rather than relying on broad impressions like “buyers look strong” or “that level should hold,” he learned to evaluate specific evidence—how liquidity behaved, how orders were executed, and how price responded to those interactions. That made the entire decision-making process more objective and, just as importantly, made every mistake easier to understand and learn from.
In the end, perhaps that’s the most valuable lesson his journey offers.
The edge wasn’t hidden in a new indicator or a secret setup.
It came from learning to observe the auction more carefully, allowing the market to confirm—or reject—each idea before acting on it.
Because the best trading decisions aren’t made by reacting to where price has already been.
They’re made by understanding what the market is doing right now.
 Twitter
 Facebook