
From Strategy-Hopping to Reading the Auction: How Zach Uses Bookmap to See What Candlesticks Can’t
For Zach of Real Deal Futures, becoming a better trader was never about finding one indicator that suddenly made the market easy to read. His journey has taken him through stocks, FX, and eventually futures, with plenty of experimentation along the way. Like many traders early in their careers, he spent time moving between strategies and adding indicators in search of something that would finally make everything click.
By the time Zach transitioned to futures, however, his approach had started to change. Instead of searching for a new strategy to replace everything that came before it, he was becoming more interested in the information behind price movement. Futures gave him access to centralized volume and Level 2 market data that he hadn’t been able to use in the same way while trading FX. That opened the door to volume profiles, composite profiles, depth of market, and eventually Bookmap.
Today, after roughly seven years in the markets, Zach primarily trades NQ and YM and uses Bookmap alongside the rest of his trading process. His story isn’t about abandoning candlestick charts or finding a tool that predicts what the market will do next. It’s about learning to see another part of the auction and using that information to make more informed decisions.
From FX to Futures: Zach’s Trading Journey
Zach’s trading journey began with stocks before moving heavily into FX. The early years included losses, experimentation, and plenty of strategy-hopping. He remembers having indicators all over his charts and searching for what he calls the “holy grail,” something that would finally provide the answer he was looking for.
Experience gradually changed that mindset. Instead of constantly searching for a completely new approach, Zach began refining what was already working and thinking more carefully about the information he used to make decisions. When he eventually transitioned from FX into futures, access to centralized exchange data gave him an opportunity to take that process further.
One of the biggest differences was volume. While Zach had access to volume information through FX brokers, it wasn’t the same centralized exchange volume available in futures. Moving into futures meant he could start working with reliable volume data and then explore Level 2 market information as well. He began using volume profiles and composite profiles before turning his attention to depth of market.
The potential value of that information was clear to him, but actually reading it was much harder. A traditional DOM moves quickly, with orders constantly appearing, changing, and disappearing. Zach remembers looking at it and wondering how he would ever track everything happening in real time. He knew there was useful information there, but turning that stream of numbers into something he could comfortably use while trading felt intimidating.
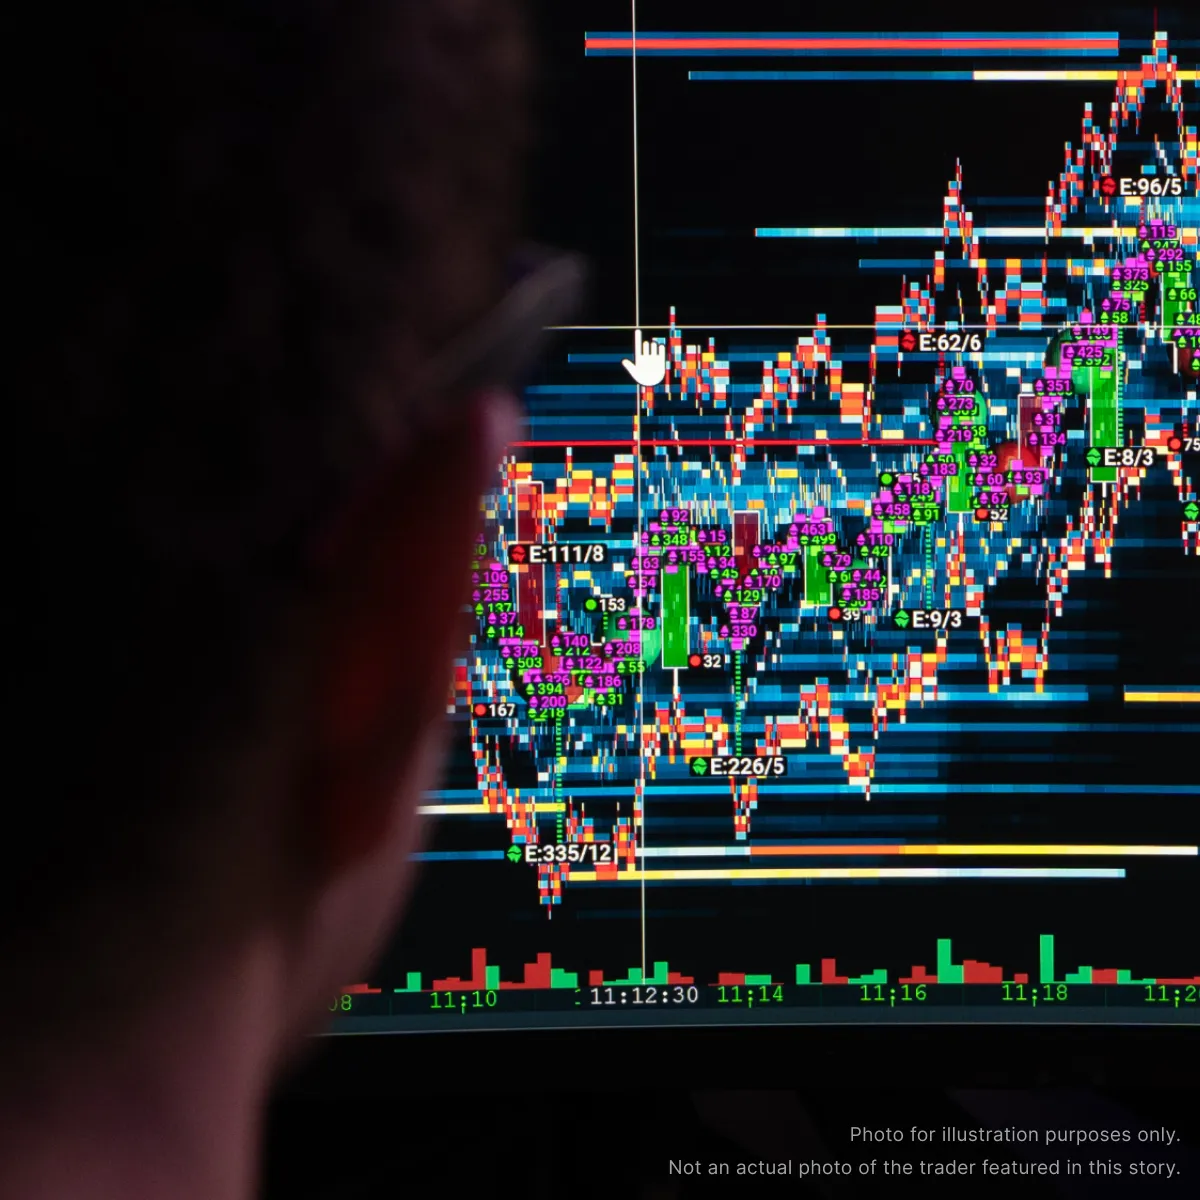
That was the context in which he first encountered Bookmap. At first, it didn’t exactly look simpler. Zach jokingly compared the colorful heatmap to the thermal vision from the movie Predator. His reaction was essentially: what am I looking at?
Curiosity eventually won. He decided to test it himself and discovered that the visualization was much easier for him to understand than he initially expected. Rather than trying to process a rapidly changing column of numbers, he could see liquidity visually and observe how it developed as the market moved.
“Lo and behold, it was much simpler than I thought.”
How Bookmap Changed the Way He Reads Liquidity
The value of Bookmap became clearer as Zach spent more time watching how price interacted with resting orders. At the time, he was trading ES frequently and began noticing significant stacks of liquidity appearing in the order book. Instead of simply seeing that size existed at a particular moment, he could watch how it behaved over time and what happened when price eventually reached it.
That added a new dimension to the levels Zach was already using. His existing process included market structure, volume profiles, prior-day and prior-week levels, overnight levels, and other areas that could provide context for a trade. Those levels remained useful, but they couldn’t tell him where a market participant might suddenly place significant size during the session.
Bookmap helped fill that gap. Zach could see liquidity building somewhere that wasn’t already marked as one of his predetermined areas of interest. He could then observe whether those orders remained in place as price approached, whether they were traded, and how the market reacted afterward. In that sense, Bookmap wasn’t giving him a new set of horizontal levels to trade blindly. It was showing him how the live auction was developing around and between the levels he already understood.
This distinction is important because Zach doesn’t treat visible liquidity as an automatic signal. A large order can be pulled before price reaches it. It can be traded through without producing much reaction. It can also become part of a meaningful rejection. The size itself is only one piece of information.
Instead, Zach pays attention to the interaction between liquidity, executed volume, speed, and price reaction. When price reaches an area with significant size, he wants to know what happens next. Does the market continue through the level with strong participation? Does it stall? Are the orders absorbed before price reverses? Does the market fail to continue despite aggressive buying or selling?
That is also where CVD fits into his process. Zach monitors CVD alongside the heatmap to add more context about the volume being executed as price interacts with an area.
Rather than asking Bookmap to produce a complete trading decision, Zach describes it more like a blind spot monitor. It can alert him to something happening in the market that his candlestick chart alone may not reveal.
Inside a Real NQ Trade
One trade Zach shared during his User Success Story demonstrates how this works in practice. The example came from NQ and had been taken during a live trading stream, giving him a recent trade to break down rather than a theoretical setup.
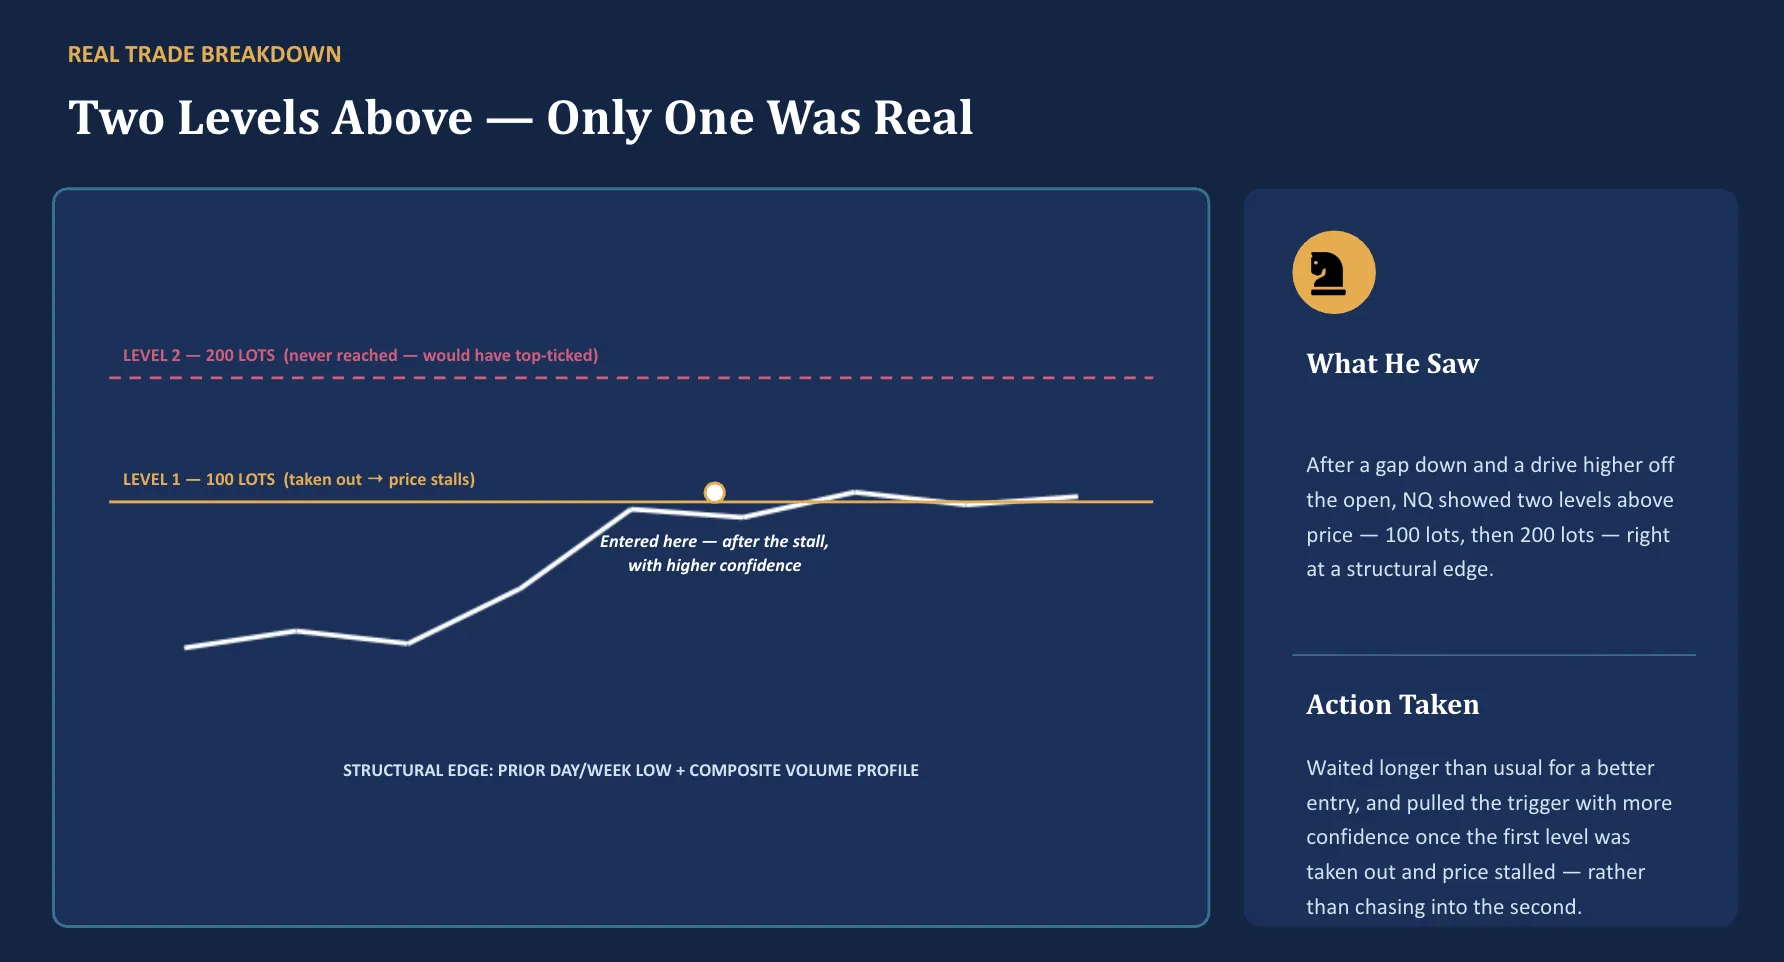
The session had opened after a gap down, and NQ pushed higher from the open and moved above VWAP. Zach wasn’t immediately looking to fade the move. Instead, he remained patient as price moved higher into an area that included the prior week’s low and Friday’s low. There had also been significant volume around the broader area following the gap down and session changeover.
From his existing analysis, Zach was interested in a possible mean-reversion move back toward VWAP. The candlestick chart provided the broader structure for that idea, but Bookmap gave him additional information about what was waiting above price.
On the heatmap, Zach could see substantial resting orders stacked at two levels. The first contained roughly 100 lots, with a larger level above it. He didn’t immediately short simply because those orders were visible. Instead, he watched the interaction as price approached.
The first level was eventually taken out, but price then began to stall and selling pressure appeared. The second liquidity level remained higher. That reaction helped give Zach more confidence in the short idea he was already considering. He entered above the first area rather than chasing price all the way toward the second level.
The trade eventually moved back toward VWAP. Zach is careful not to portray the example as an enormous move or proof that liquidity levels automatically produce reversals. In fact, he explicitly points out that large orders don’t always lead to a significant reaction. Sometimes they are traded through, sometimes they disappear, and sometimes the market simply continues.
What mattered in this particular trade was the sequence. Zach already had a broader reason to consider a short. Bookmap then showed him where meaningful size was sitting, and the market’s behavior after trading through the first level added information he couldn’t get from the candlestick chart alone.
“For me it’s kind of like a blind spot monitor.”
That description captures the role Bookmap played in the trade. It didn’t create the entire setup. It gave Zach another way to evaluate what was happening while the setup developed.
How Bookmap Fits Into Zach’s Trading Setup
One of the more useful aspects of Zach’s approach is that adopting Bookmap didn’t lead to a dramatic overhaul of his trading. His candlestick charts remained. His existing levels remained. The volume and market structure concepts he had already developed remained part of his process.
Bookmap became another screen and another source of information.
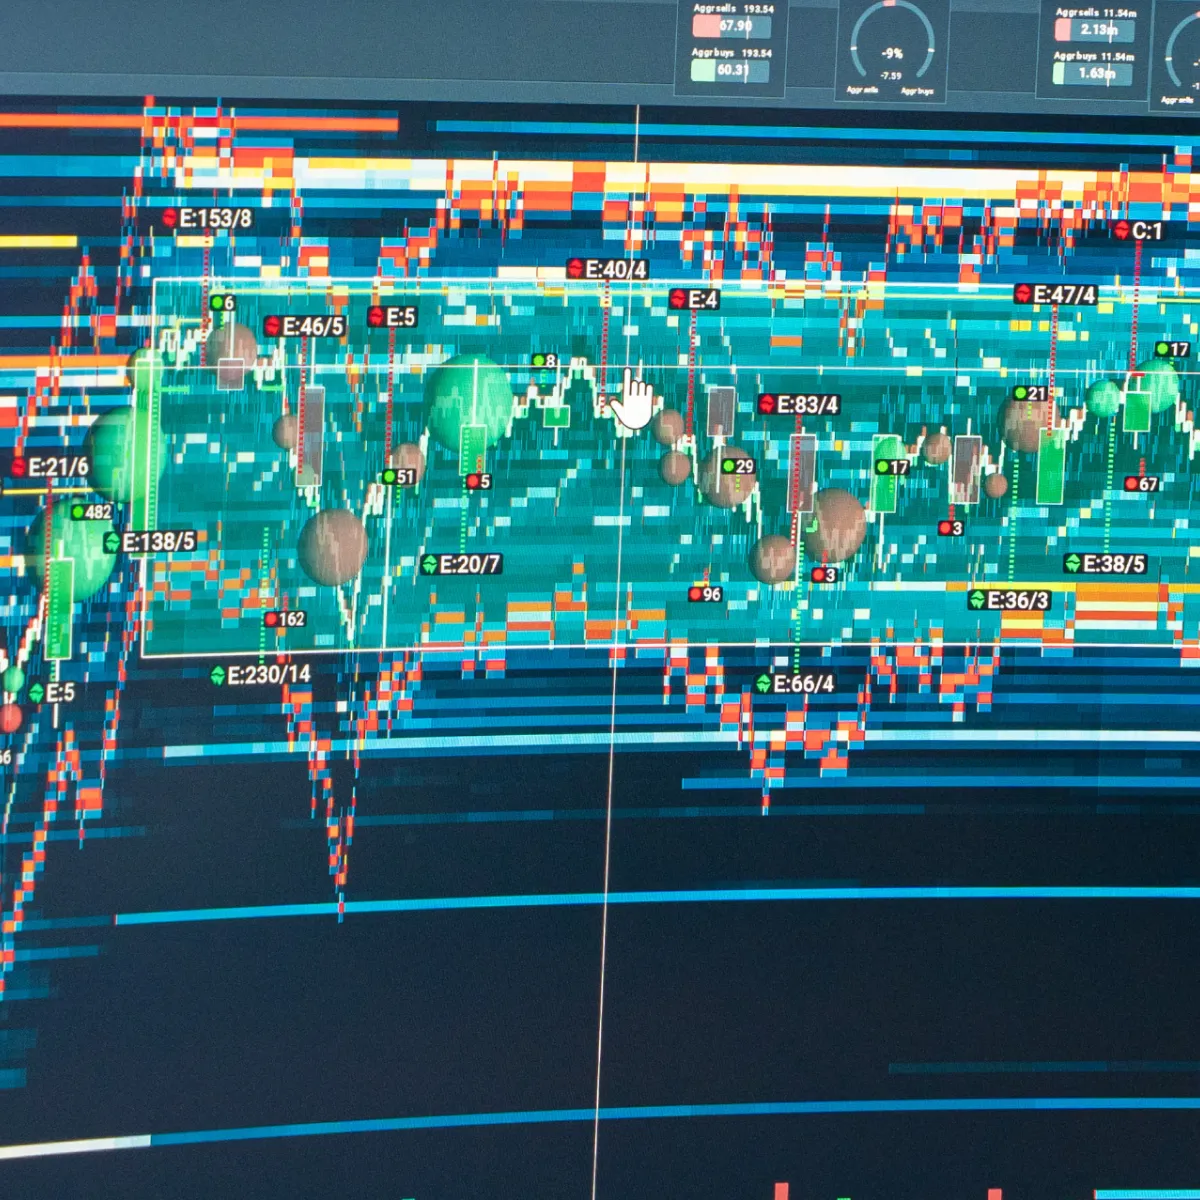
Zach typically keeps it visible alongside his other tools, and he likes monitoring NQ and ES side by side on a full-screen monitor. This allows him to keep the heatmap available without forcing every decision through it.
His Bookmap setup is also relatively simple compared with what the platform can support. Bookmap offers additional tools for traders who want to monitor different types of order-flow activity, but Zach doesn’t believe every feature needs to be active simply because it’s available. He has experimented with different tools and settings, but his focus remains on the information that makes sense within his own process.
That simplicity reflects a broader lesson from his trading journey. Earlier in his career, adding more indicators was part of the search for something that would finally work. Today, he is more selective. The goal isn’t to fit as much information as possible onto a screen. It’s to understand which information actually contributes to a decision.
That is also why Zach encourages newer users to watch different traders rather than copying one person’s setup. He spent time with Bookmap’s educational videos and also explored how other traders used the platform. Some rely on a relatively simple heatmap, while others incorporate Stops & Icebergs, additional profiles, indicators, and more advanced configurations.
Seeing those different approaches helped him understand what was possible, but the next step was deciding what suited him personally.
“There are so many traders doing so many different things with these tools.”
For Zach, the useful approach was to explore first and refine later. A trader doesn’t need to use every available tool. They need to understand what they’re looking at and determine whether it adds something meaningful to their existing process.
Why Screen Time Matters With Order Flow
Zach also emphasizes that learning to read order flow takes time. He doesn’t believe someone can necessarily load Bookmap for a few sessions and make a meaningful judgment about whether it fits their trading.
The reason isn’t simply that the platform takes time to learn. The market itself changes.
NQ can look very different from one session to another. A choppy, consolidating market may repeatedly react to liquidity above and below price, while a strong trending session can produce completely different behavior. Contract rollover can alter what appears in the order book as liquidity shifts between contracts. Even when the same tools and settings are used, the information needs to be interpreted within the conditions of that particular session.
Zach’s own learning process reflected that. Rather than immediately incorporating Bookmap into his entries and trade management, he initially put it on a second screen and watched. His familiar charts and tools remained the basis of his decisions while he observed what Bookmap was showing at the same time.
As he accumulated more screen time, he started recognizing how the order book behaved around different types of price action. Only then did he begin incorporating that information more directly into entries and trade management, adding it gradually rather than rebuilding his strategy around it overnight.
“You got to give it some time. You got to have a sample size on it.”
Over the years, that repeated exposure made the information increasingly familiar. What initially looked like an intimidating collection of colors and bubbles became something Zach could interpret alongside the rest of his analysis.
Review also plays a role in that process. Zach can keep Bookmap running during the session and later look back at what happened around a trade or an area he was watching. If he entered a position based primarily on his traditional charts, he can review what liquidity and executed volume looked like at the same moment. If he missed something while trading, he can go back and examine whether there was information on the heatmap that would have been useful.
That kind of review helps turn isolated observations into experience. Over time, the trader isn’t simply seeing a large order on the screen. They’re comparing the current interaction with hundreds of previous examples they’ve watched under different conditions.
What Changed in Zach’s Trading
The biggest change in Zach’s trading isn’t a completely different strategy. In fact, he is clear that Bookmap hasn’t produced a massive overhaul in his habits or replaced the other tools he uses.
What changed is his visibility into the market.
Before incorporating order flow, Zach could identify important areas from price structure, volume profiles, prior-session levels, and other forms of analysis. What he couldn’t see as clearly was where significant resting liquidity was developing in real time or how the market was interacting with that liquidity beneath the candlestick chart.
Now, when size begins building somewhere relevant, he can see it. When price approaches, he can watch whether the orders remain or disappear. If they trade, he can observe the executed volume and subsequent reaction. That gives him another source of information when evaluating an entry or managing a position.
For a trader like Zach, who may not wait for multiple candle closes before entering, that can be particularly useful. He explained that watching orders come onto and off the book and then observing how price reacts around those areas can provide a read on potential continuation or reversal.
The result is not certainty. Zach doesn’t claim to know what the market will do simply because he can see liquidity. Instead, he describes having more confidence in his read because he has access to information that wasn’t visible on his candlestick chart alone.
That distinction matters. Trading confidence doesn’t need to mean believing a trade cannot lose. It can simply mean having a clearer reason for taking the trade and understanding the information supporting the decision.
From Searching for the Holy Grail to Building a Process
There is a noticeable difference between the way Zach describes his early trading and the way he talks about tools today. Earlier in his journey, he remembers strategy-hopping and filling charts with indicators while searching for something that would finally provide the answer.
Years later, he is explicit that neither Bookmap nor order flow should be treated that way.
“It’s not the magic answer to all of your problems.”
Bookmap doesn’t mean every visible liquidity level should be traded. It doesn’t eliminate losing trades, and it doesn’t remove the need to understand market context. Zach finds the information extremely useful, but he also believes traders need enough experience with it to understand when that information matters and when it doesn’t.
That makes his experience with Bookmap very different from his earlier search for the next strategy. Rather than asking the platform to provide an entire trading methodology, he uses it to answer narrower questions about the live auction. Where is liquidity building? What happens as price approaches it? How much volume trades there? Does the market continue or reject? Does that behavior support the trade he was already considering?
Those questions don’t remove uncertainty from trading, but they give Zach another way to evaluate it.
Zach’s Advice for Traders Exploring Order Flow
For someone considering order flow for the first time, Zach’s advice is to avoid making a decision too quickly. A few days of watching the heatmap may not provide enough exposure to understand how it behaves across different market conditions. He recommends giving it a meaningful sample size and allowing time for the information to become familiar.
His own approach offers a straightforward way to do that. Keep the tools and charts you already understand, place Bookmap alongside them, and observe before trying to incorporate every piece of order-flow information into your trading. Pay attention to where liquidity builds, how price behaves as it approaches, what volume trades at the level, and what happens immediately afterward.
It can also help to watch several traders use Bookmap rather than assuming there is one correct configuration or workflow. Zach’s setup is relatively simple because that’s what fits his process. Another trader may find value in completely different features. The goal is not to reproduce someone else’s screen. It’s to determine what information helps you understand the market you trade.
For Zach, taking that time transformed Bookmap from what looked like an intimidating “Predator heatmap” into a practical part of his trading environment. It didn’t replace the process he had spent years developing, and it didn’t provide the holy grail he once searched for.
Instead, it gave him something more useful: one more lens on the auction.
 Twitter
 Facebook