
Less on the Screen, More in the Process: How One Decade-Plus Trader Learned to Read Liquidity Instead of Predicting It
 “Bookmap clicked for me when I let it speak mostly in pure liquidity terms — and just focused on that instead of anything else.” — Moby (Bookmap Trader)
Most traders don’t struggle to find tools. They struggle to stop collecting them.
Multi Charts. NinjaTrader. Sierra Chart. Jigsaw. A decade of platforms, each one promising a cleaner read on the market than the last. For a trader who has tested and coded for nearly all of them, the real problem was never a lack of options. It was the opposite: too many ways to look at the same market, and no clear sense of which one actually mattered when a trade was on the line.
For one Bookmap user, the answer turned out to be almost the opposite of adding another tool. It was stripping nearly everything else away.
Meet the Trader: A Decade of Testing Everything
Trading for more than ten years, Moby has never confined himself to one instrument or one style. His day splits across two speeds: short-term futures trades — mostly the Micro NASDAQ (MNQ) during extended hours, with MES and MNQ during regular trading hours — and slightly longer intraday options trades on single stocks, usually zero-to-five days from expiry. Different markets, same underlying edge, just carried across a different risk profile.
That range came from years of platform-hopping before Bookmap ever existed. He bought a lifetime license to Multi Charts back when it was mainly built for algorithmic traders, learned gold and index futures on it, then moved through NinjaTrader and Sierra Chart, where he still runs custom tools today. Along the way, he picked up something more valuable than any single platform: the instinct that no one tool tells the whole story.
“I cannot say that I rely on any one tool,” he says. “I’ve tested and coded for most of them, and many have pros as well as cons.”
That instinct — treat every tool as partial, never complete — became the foundation for everything that followed.
The Struggle: No Single Tool Ever Covered Everything
Before settling into his current process, Moby’s challenge wasn’t a lack of market knowledge. He’d already spent years building it. It was the gap between having a read on the market and actually being able to act on it in real time.
Fear of loss made it harder to pull the trigger even when his analysis was right. A huge breadth of instruments and data needed tracking before a single ES or NQ trade even entered the picture. And underneath all of it sat a harder truth: some days are pure noise, and reading which days those are matters as much as reading price itself.
“The market is hard,” he says. “Full stop.”
That’s not a complaint about the market being unfair. It’s an acknowledgment that no amount of preparation removes the uncertainty — the job is deciding what to do with that uncertainty in the moment.
Finding Bookmap Through Big Mike’s Forum

Moby found Bookmap around 2015, discovered through Big Mike’s — a futures trading forum that, in the years before trading Discord servers and social feeds took over, hosted regular webinars and community discussion not unlike what Bookmap runs today. A handful of presentations and an early introductory offer were enough to get him to try it.
He went in with low expectations. Not skepticism exactly — just no particular promise to himself about what it would change. What he found instead was a pure monochrome heatmap, a fraction of today’s feature set, and a fundamentally different rhythm to the market itself: in the early ES days, price wouldn’t move a tick until hundreds of resting orders cleared. The DOM was still the main tool. Bookmap was, at first, a more visual version of the same slow read.
One thing was confusing from the start and stayed that way: the bid/ask line running alongside price. He still skips it today, filing it under noise rather than signal.
The bigger shift, in his telling, wasn’t a feature. It was data. When Bookmap introduced its own proprietary data feed, replacing the rhythmic feed he’d struggled with for years — one plagued by 30-second lag and a hard monthly cap that regularly left him with no trade history to review — it changed what he could actually trust on the screen. “Bookmap added its own data and took it to a different level,” he says. “Before that, you had no real history, and that makes a big difference.”
When Bookmap Clicked: Liquidity as Magnetism, Not a Wall

The moment Bookmap moved from “another tool” to “the tool” came down to one shift in interpretation: what large resting liquidity actually means.
Like most traders new to order flow, Moby originally assumed a big liquidity wall would act the way a support or resistance line does on a candlestick chart — a level price would respect. It doesn’t always hold. Sometimes size gets eaten straight through, as easily as it holds a level. What Bookmap gave him wasn’t a rule for telling those two outcomes apart in advance. It was a way of watching, in real time, which one was actually happening.
“Bookmap clicked for me when I let it speak mostly in pure liquidity terms,” he says, “and just focused on that instead of anything else.”
Over time, that observation turned into a genuine pattern: liquidity often behaves less like a wall and more like a magnet. Resting liquidity stacked above price on both NQ and ES at once has kept him out of plenty of shorts that looked tempting on a candlestick chart alone — because the setup wasn’t rejection, it was a level quietly drawing price toward it.
He’s also deliberately narrowed what he pays attention to. Absorption and resting liquidity now drive his read of the market — not CVD, not iceberg data, just where size is sitting and how price actually responds when it gets there. Risk management, by contrast, stays entirely outside Bookmap, handled formulaically inside Sierra Chart. The split is intentional: one tool reads the auction, another manages the exposure. Neither one tries to do both.
Trade Breakdown: Holding Through the Wiggles
One trade captures how that shift in interpretation plays out under real conditions.
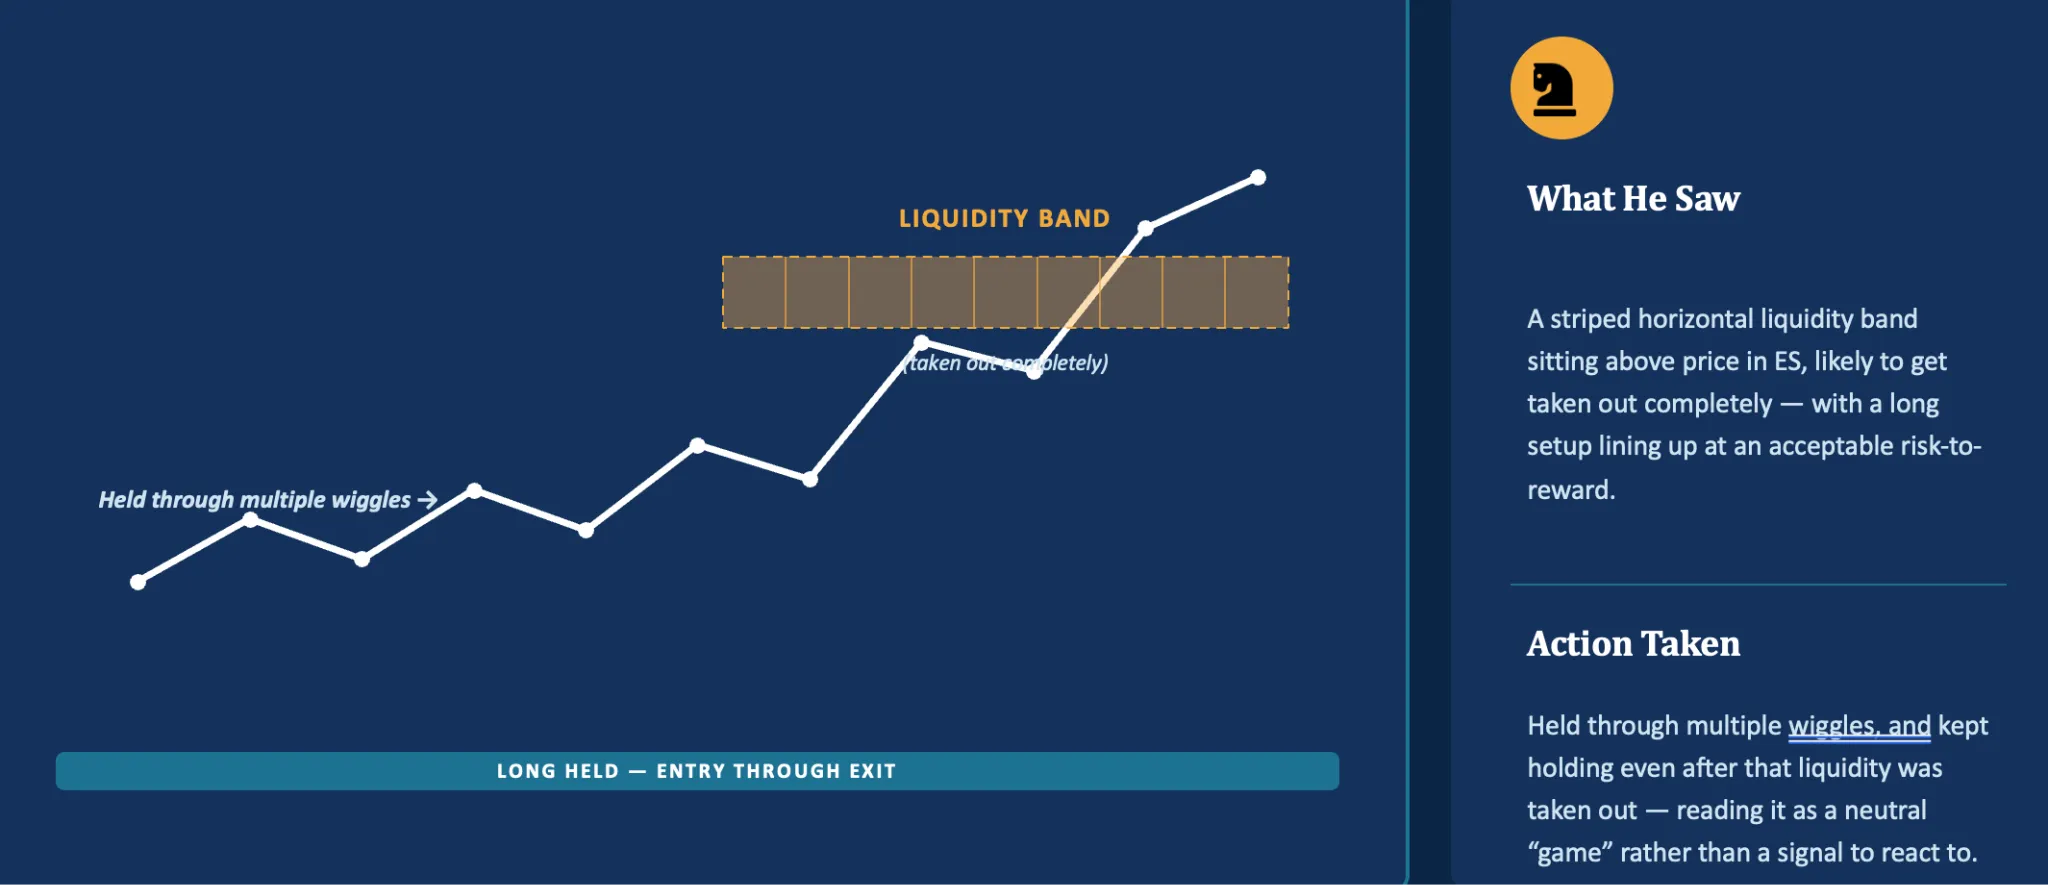
The setup formed around a striped horizontal liquidity band sitting above price in ES — the kind of resting liquidity that, on the older mental model, might have looked like a hard ceiling. Instead, Moby read it as likely to get taken out completely, with a long setup lining up at an acceptable risk-to-reward underneath it.
He entered, and the trade didn’t move cleanly. Price wiggled repeatedly against the position before the liquidity band was finally taken out in full. Many traders would have read that liquidity disappearing as a signal to exit, or at least to second-guess the thesis. Moby held through it — not out of stubbornness, but because he was reading the wiggles as a neutral part of the auction rather than a signal demanding a reaction.
“I’m reading it as a neutral game,” is how he describes that mindset, “rather than a signal to react to.”
The position stayed open from entry through exit, riding out the noise that the liquidity level generated on its way to being consumed. The lesson wasn’t really about that one trade. It was the broader habit underneath it: not every wiggle, and not even every liquidity level getting taken out, is information that demands action. Some of it is just the market doing what markets do on the way to where they’re going.
The Hiatus: One Step Forward, Two Steps Back
Moby’s relationship with Bookmap wasn’t a straight line. Early on, he stepped away for about a year and a half — one of what he calls his failings, a tendency to try things out and not always follow through. He tested other platforms during that stretch, kept trading, kept learning, and eventually came back.
The difference between those two periods is stark in hindsight.
Before: inconsistent tool use, one step forward and two steps back. Confidence about short-term direction came and went, inconsistent from session to session. Fewer options trades, less customization, less conviction behind the setups he did take.
After returning to Bookmap: it’s permanently on screen, every session, with no exceptions. Real confidence about short-term direction, backed by specific targets rather than a general sense of “this feels right.” Far more options trading, supported by custom tools he’s since built specifically around it.
The hiatus wasn’t wasted time — it’s part of why he trusts the current setup as much as he does. He tried the alternative, and came back anyway.
Building a Process, Not Just a Screen

Ask Moby what Bookmap actually is in his workflow, and the answer isn’t “the tool I trade off of.” It’s one slot in a larger process — deliberately just one.
That process runs on four things. First, Bookmap holds a fixed, permanent slot both on his monitors and inside his broader checklist — not the whole process, just one part of a much larger one. Second, he runs standardized checklists for his short-term trades, refined over years from past mistakes and increasingly coded with AI assistance rather than held only in memory. Third, he watches and digests a wide range of markets and data simultaneously across four monitors — most of it macro-level, glanced at rather than stared at. Fourth, custom process tools — many of them built with AI over the last year — now standardize a lot of what used to be pure judgment calls.
That last shift matters more than it might sound. Moby has leaned hard into using AI to accelerate research that used to take him days or weeks, and to build the small custom tools — from Sierra Chart indicators to options-screening scripts — that translate a Bookmap read into action in other markets. When a setup on ES suggests conviction, he’s not limited to trading ES or NQ; he built his own tooling to find the best-aligned stock option and get into it quickly, because he found the existing options platforms for that workflow “hopeless.”
The common thread across all four pieces: Bookmap tells him what the auction is doing. Everything else — checklists, risk parameters, execution tooling — exists to translate that read into a disciplined decision, not an emotional one.
A Few Close Connections
Moby’s path through the Bookmap community has been narrow by design rather than wide. He liaises closely with a handful of fellow members and stays open to new conversations, several of which have turned into real friendships over the years — including with people on the Bookmap team itself.
FuturesTrader71 was one of the earliest influences, back when FT71 was among the first presenters trading via Bookmap and doing detailed analysis on zigzags and harmonic rotations — work that used to take hours by hand and now takes seconds. Tom remains a current source of value, filtered, as everything is, through Moby’s own independent process rather than adopted wholesale.
“I very much follow my own path,” he says — which sums up both his relationship to the community and his relationship to every tool he’s ever used, Bookmap included.
Advice for New Users: Keep the Toy Box Small
Asked what he’d tell someone opening Bookmap for the first time, Moby’s answer isn’t about mastering every feature quickly. It’s close to the opposite.
Use it as an auxiliary tool at first. Focus on process, consistent setups, and learning the recurring games the market plays out — the same liquidity behaviors, the same failed breakouts, showing up again and again once you know what to watch for. He points new users toward the pilot program specifically for that reason: it gives access to real data feeds you can review in replay, alongside screenshots of trades other users actually took on those same days.
His sharpest advice, though, is about restraint. Bookmap ships with a lot of optional tools and add-ons, and the temptation is to turn most of them on.
“It’s like being a 5-year-old with lots of new toys in the toy box,” he says. “Some of those toys will be really useful, and some of those toys you’ll never ever want to take out of the box again — because they just don’t help you get to what you want, because of the way that you trade.”
His own setup reflects that philosophy literally: just the liquidity map and three custom tools. No delta dots — a feature he’s been openly unenthusiastic about for years, favoring the raw picture of trades over segmented buy/sell visualizations. No default indicators he doesn’t need, because if he can see something directly on the map, he doesn’t need software to tell him it’s there.
Conclusion
Ten years in, across a half-dozen platforms and a temporary break from the one he eventually kept, Moby’s process didn’t converge on more information. It converged on less — filtered hard enough that what’s left is only what actually moves his decisions.
Bookmap’s role in that process isn’t to replace judgment or predict outcomes. It’s to answer one narrow question in real time: is liquidity holding, or is it just sitting there waiting to be taken out? Everything else — the checklists, the four monitors, the custom AI-built tools, the risk management sitting entirely outside Bookmap in Sierra Chart — exists to turn that one read into a disciplined action instead of a reaction.
As he puts it, summing up a decade of testing nearly everything and keeping almost none of it on screen:
Less on the screen. More in the process.
 Twitter
 Facebook