
Seasonality in Futures Markets: Fact, Myth, and How to Check for Yourself

A calendar date can become a market belief long before it becomes a market fact. Traders often hear claims such as “natural gas prices rise in winter” or that certain commodities always move in the same direction during a particular month.
Such seasonal trading patterns may have logical reasons, but there is no guarantee they will repeat. That raises an important question:
- Is seasonality real in trading, and how can it be tested?
Read this article to learn how futures seasonality develops, where seasonal trends may have historical support, and where they can be overstated. It also covers how to test a seasonal claim using historical data, the common pitfalls that can distort results, and why a seasonal tendency should not be treated as a standalone trading signal.
What “Seasonality” Actually Means in Futures
Seasonality in futures refers to the tendency of financial markets to show similar behavior during a particular “calendar period” or during the same time of year. These recurring patterns may have been observed across several different years.
As per general market understanding, seasonality may arise from various factors:
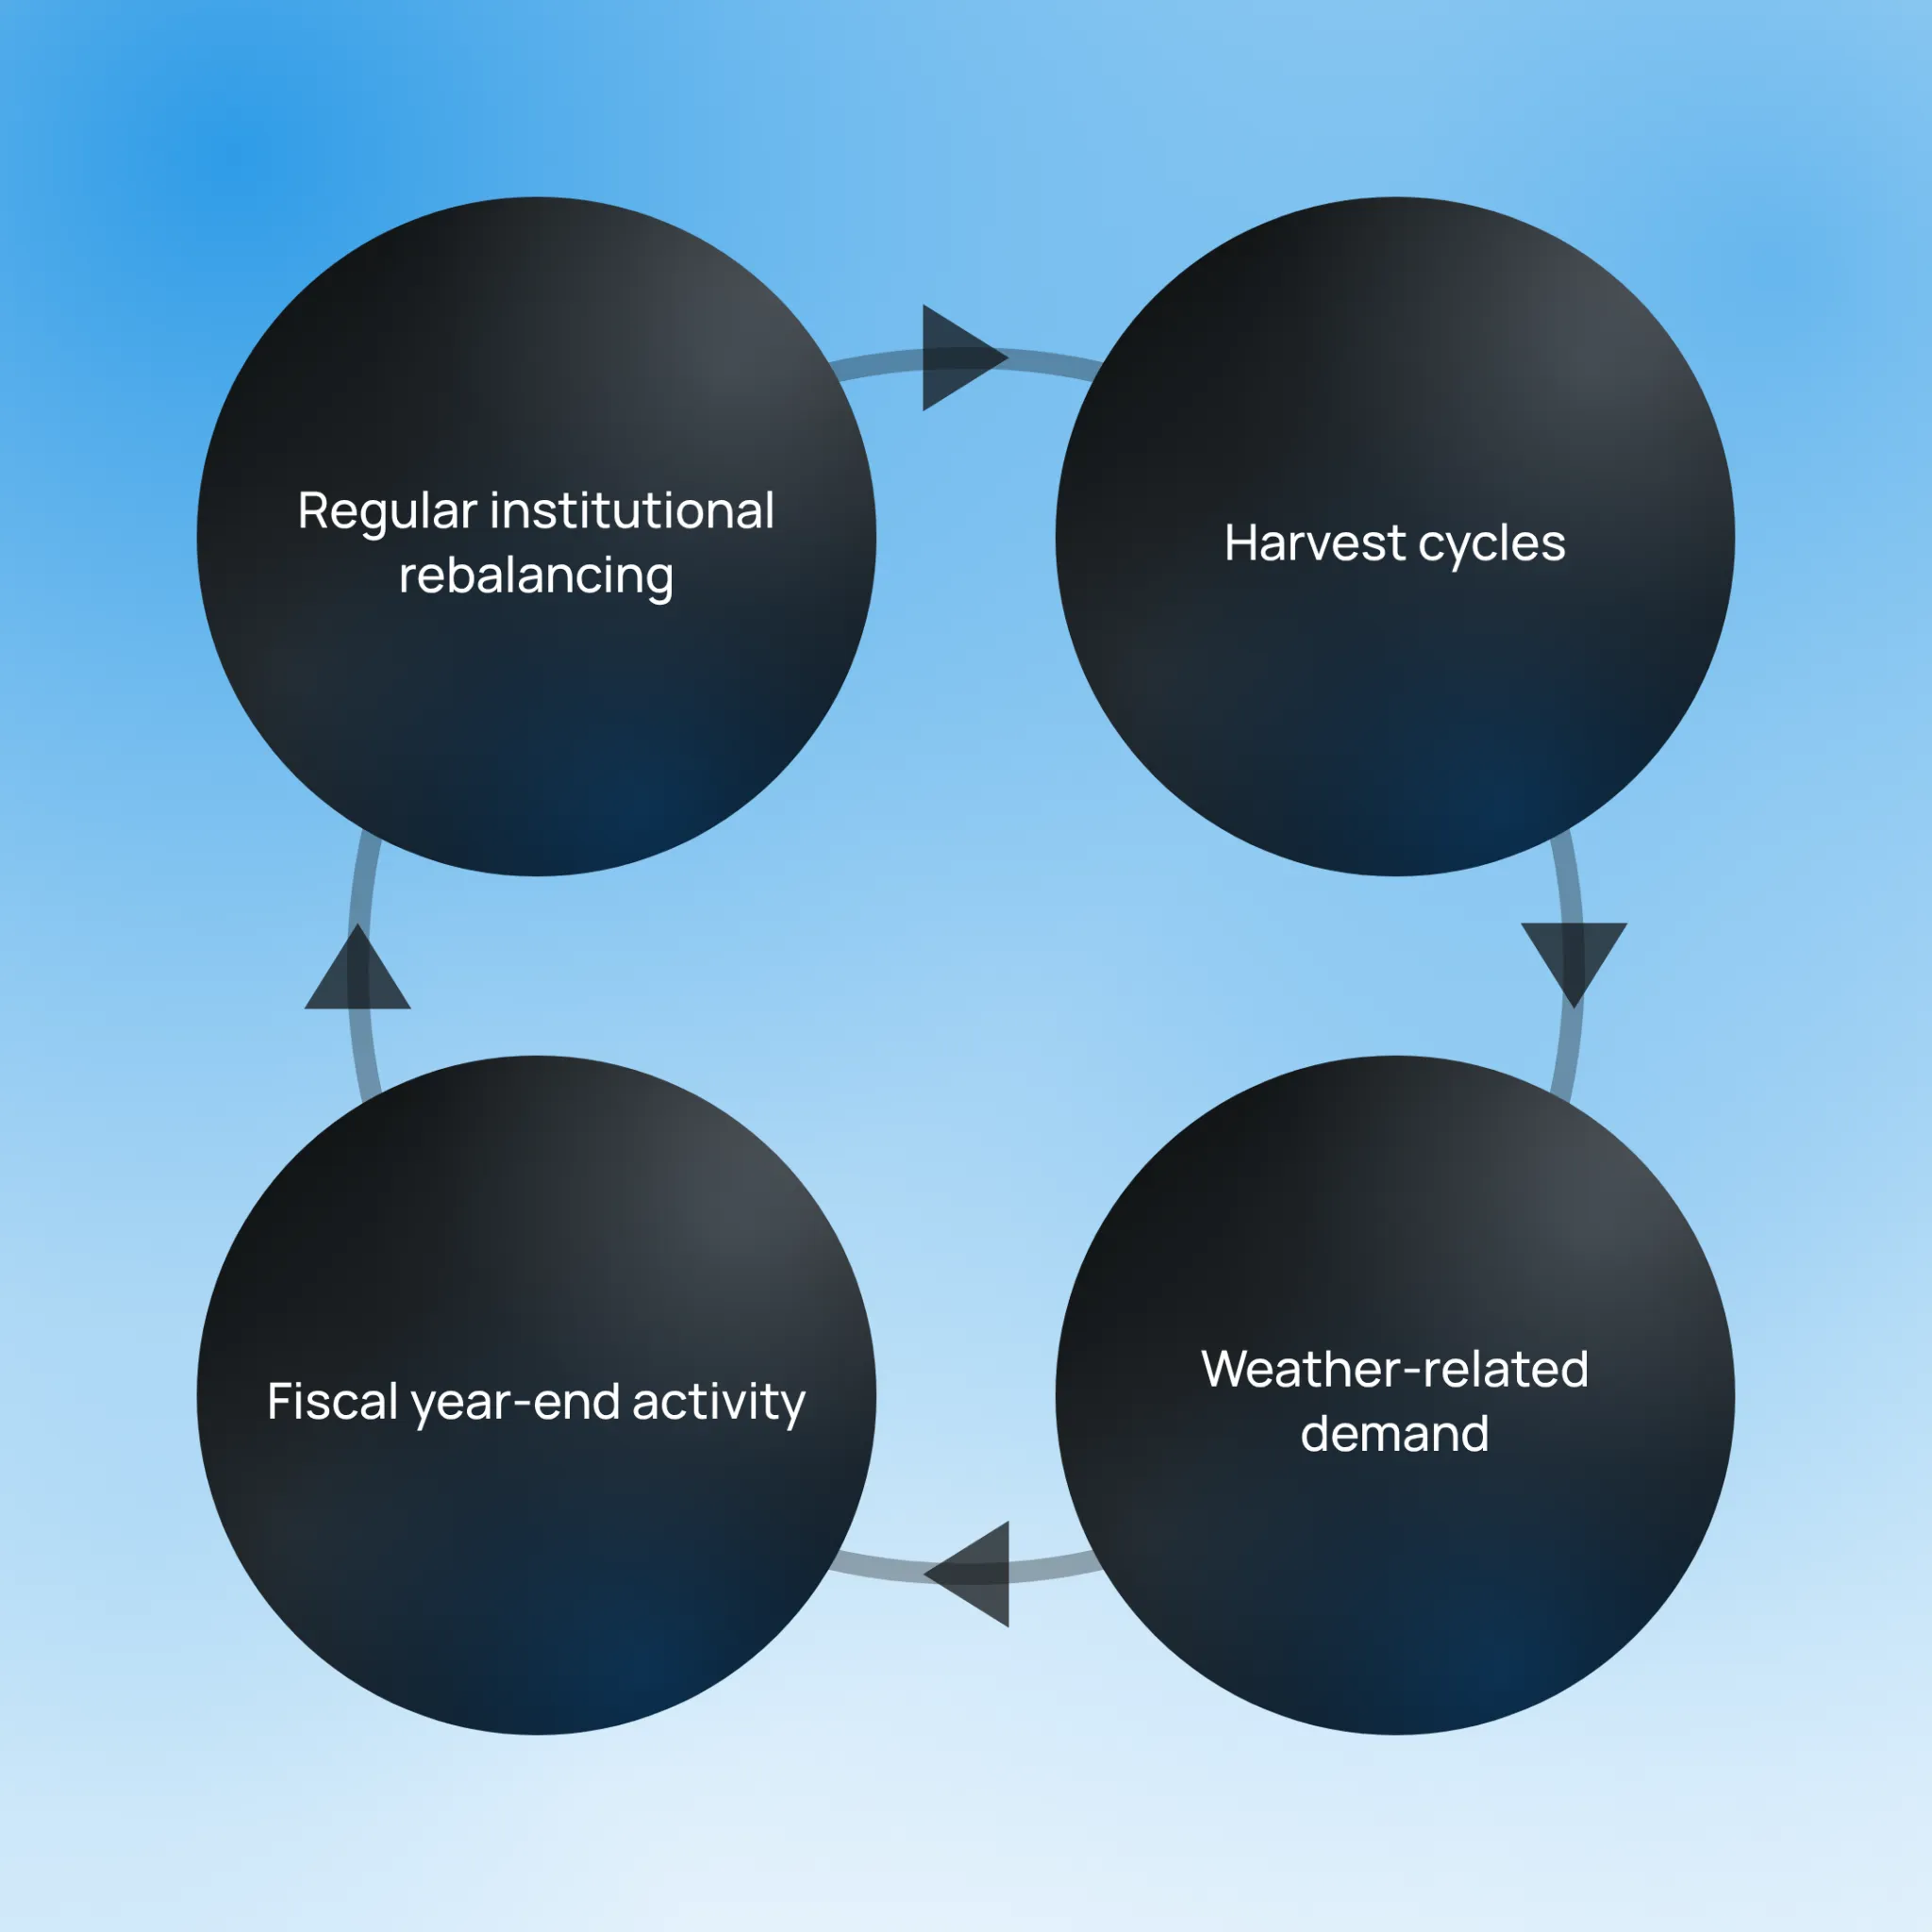
For example,
- Agricultural futures may show recurring price patterns around planting and harvest periods because crop supply changes at predictable times of the year.
- Similarly, natural gas futures are usually studied for seasonal patterns around winter, when heating demand increases.
- Equity index futures may also be examined around quarter-end periods because institutional portfolios can undergo regular rebalancing.
However, these examples are seasonal trading patterns to be tested, not guaranteed outcomes. A pattern observed in one year does not establish seasonality. Note that futures seasonality refers to a tendency that appears “repeatedly” across many years.
Therefore, market participants may not only observe whether a pattern occurred but also analyze historical data to identify a “recurring tendency” that warrants further analysis.
Why Seasonal Patterns Get So Much Attention
Seasonal patterns may attract attention, as many appear to have real-world reasons behind them. For example,
- A harvest can increase crop supply, while a fiscal year-end can lead to changes in institutional fund flows.
Such recurring events can create a logical connection between the calendar and market behavior. As a result, seasonality in futures markets can appear more convincing than a pattern based only on historical price movements.
A seasonal trend linked to a known supply, demand, or institutional event may seem easier to explain than a purely technical pattern. However, this same logic can create a problem. When a seasonal trading pattern has a plausible explanation, it can be repeated widely without sufficient statistical testing.
A convincing story does not necessarily mean that the pattern has remained consistent across many years. Therefore, seasonal trends in futures need to be examined through historical data. Additionally, statistical testing can show whether an observed seasonal pattern in a commodity has occurred consistently over many years or only during a limited historical period.
Where Seasonality Holds Up, and Where It’s Overstated
Not all seasonal trends in futures have the same level of historical support. Some seasonal effects appear across several decades and have a reasonable explanation, such as recurring changes in:
- Agricultural supply,
- Weather-driven demand, or
- Regular institutional activity.
For example, “commodity seasonality” in agricultural markets may have a strong economic basis because planting and harvest periods occur at broadly predictable times each year.
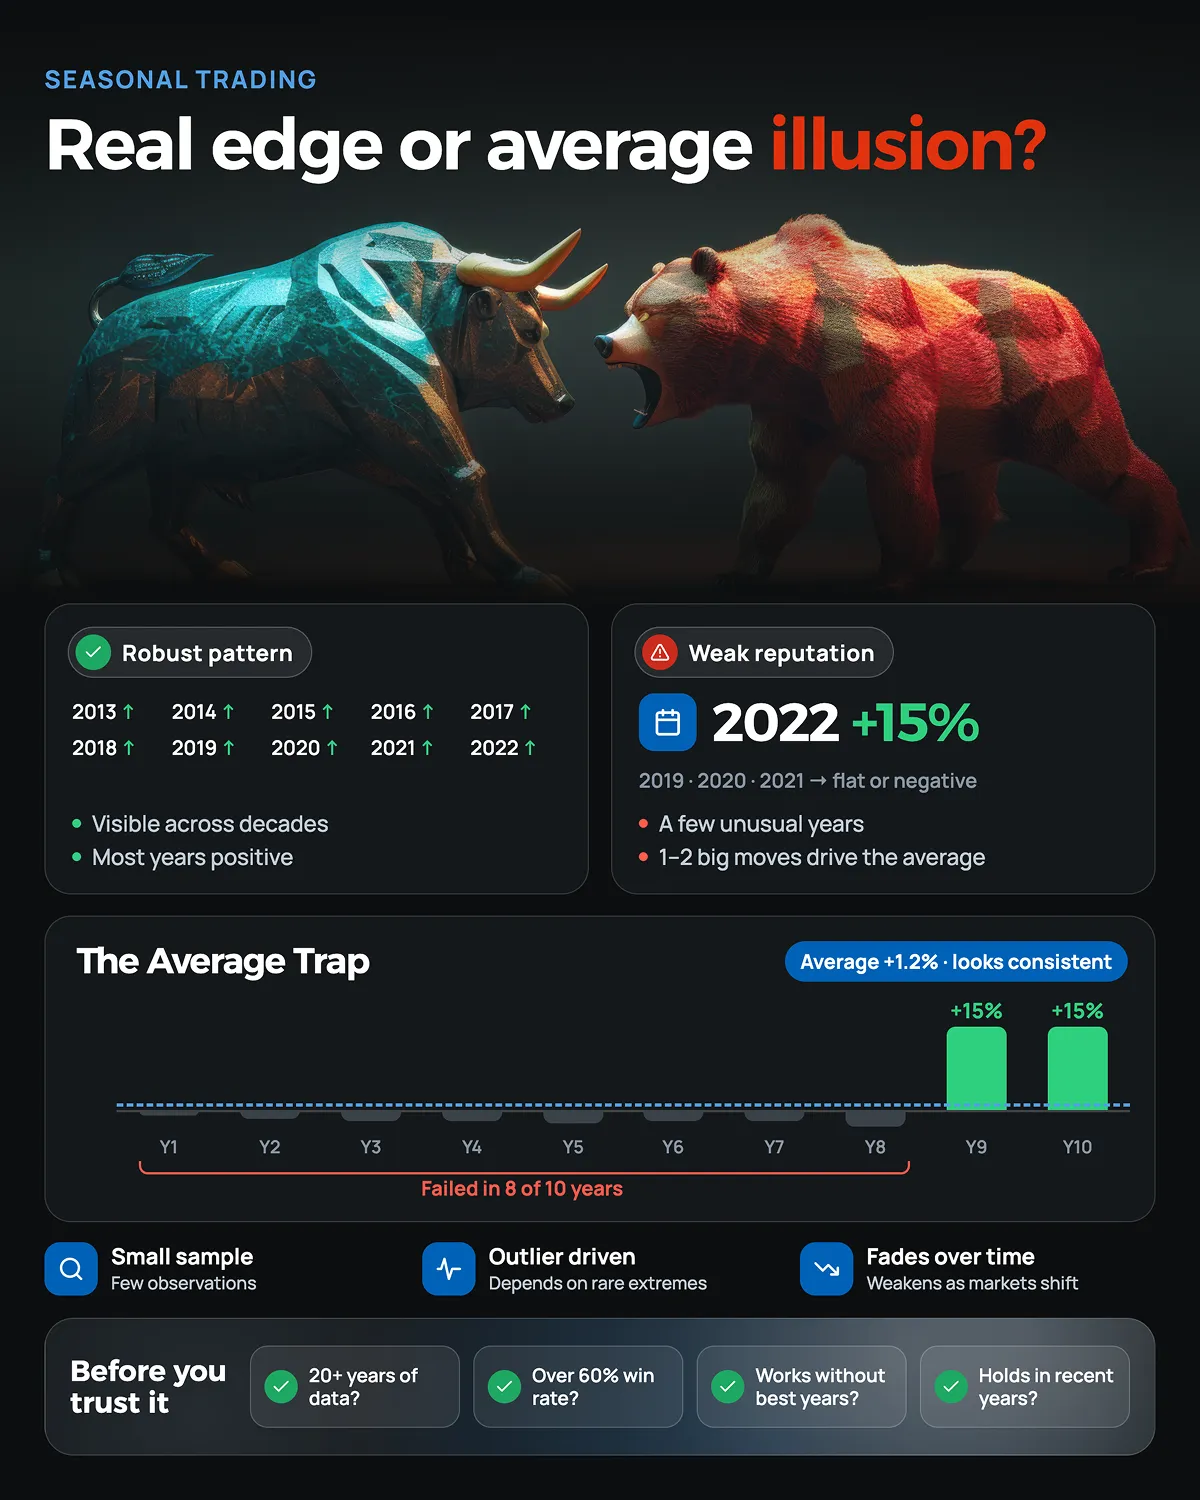
When a seasonal effect remains visible across a long historical period, it provides more evidence that the pattern is not limited to a few unusual years. However, there could be other seasonal trading patterns that have a stronger reputation than the data support.
Such patterns may look convincing because they occurred several times. But a closer look may reveal that it was based on only a few years or was driven by one or two unusually strong moves. The pattern may also weaken when market conditions change.
As a result, an “average historical return” can give the appearance of a recurring trend even when the market did not follow it in most years.
Therefore, futures seasonality should not be treated as a single category with a fixed level of credibility. Each seasonal claim needs a separate examination of the following factors:
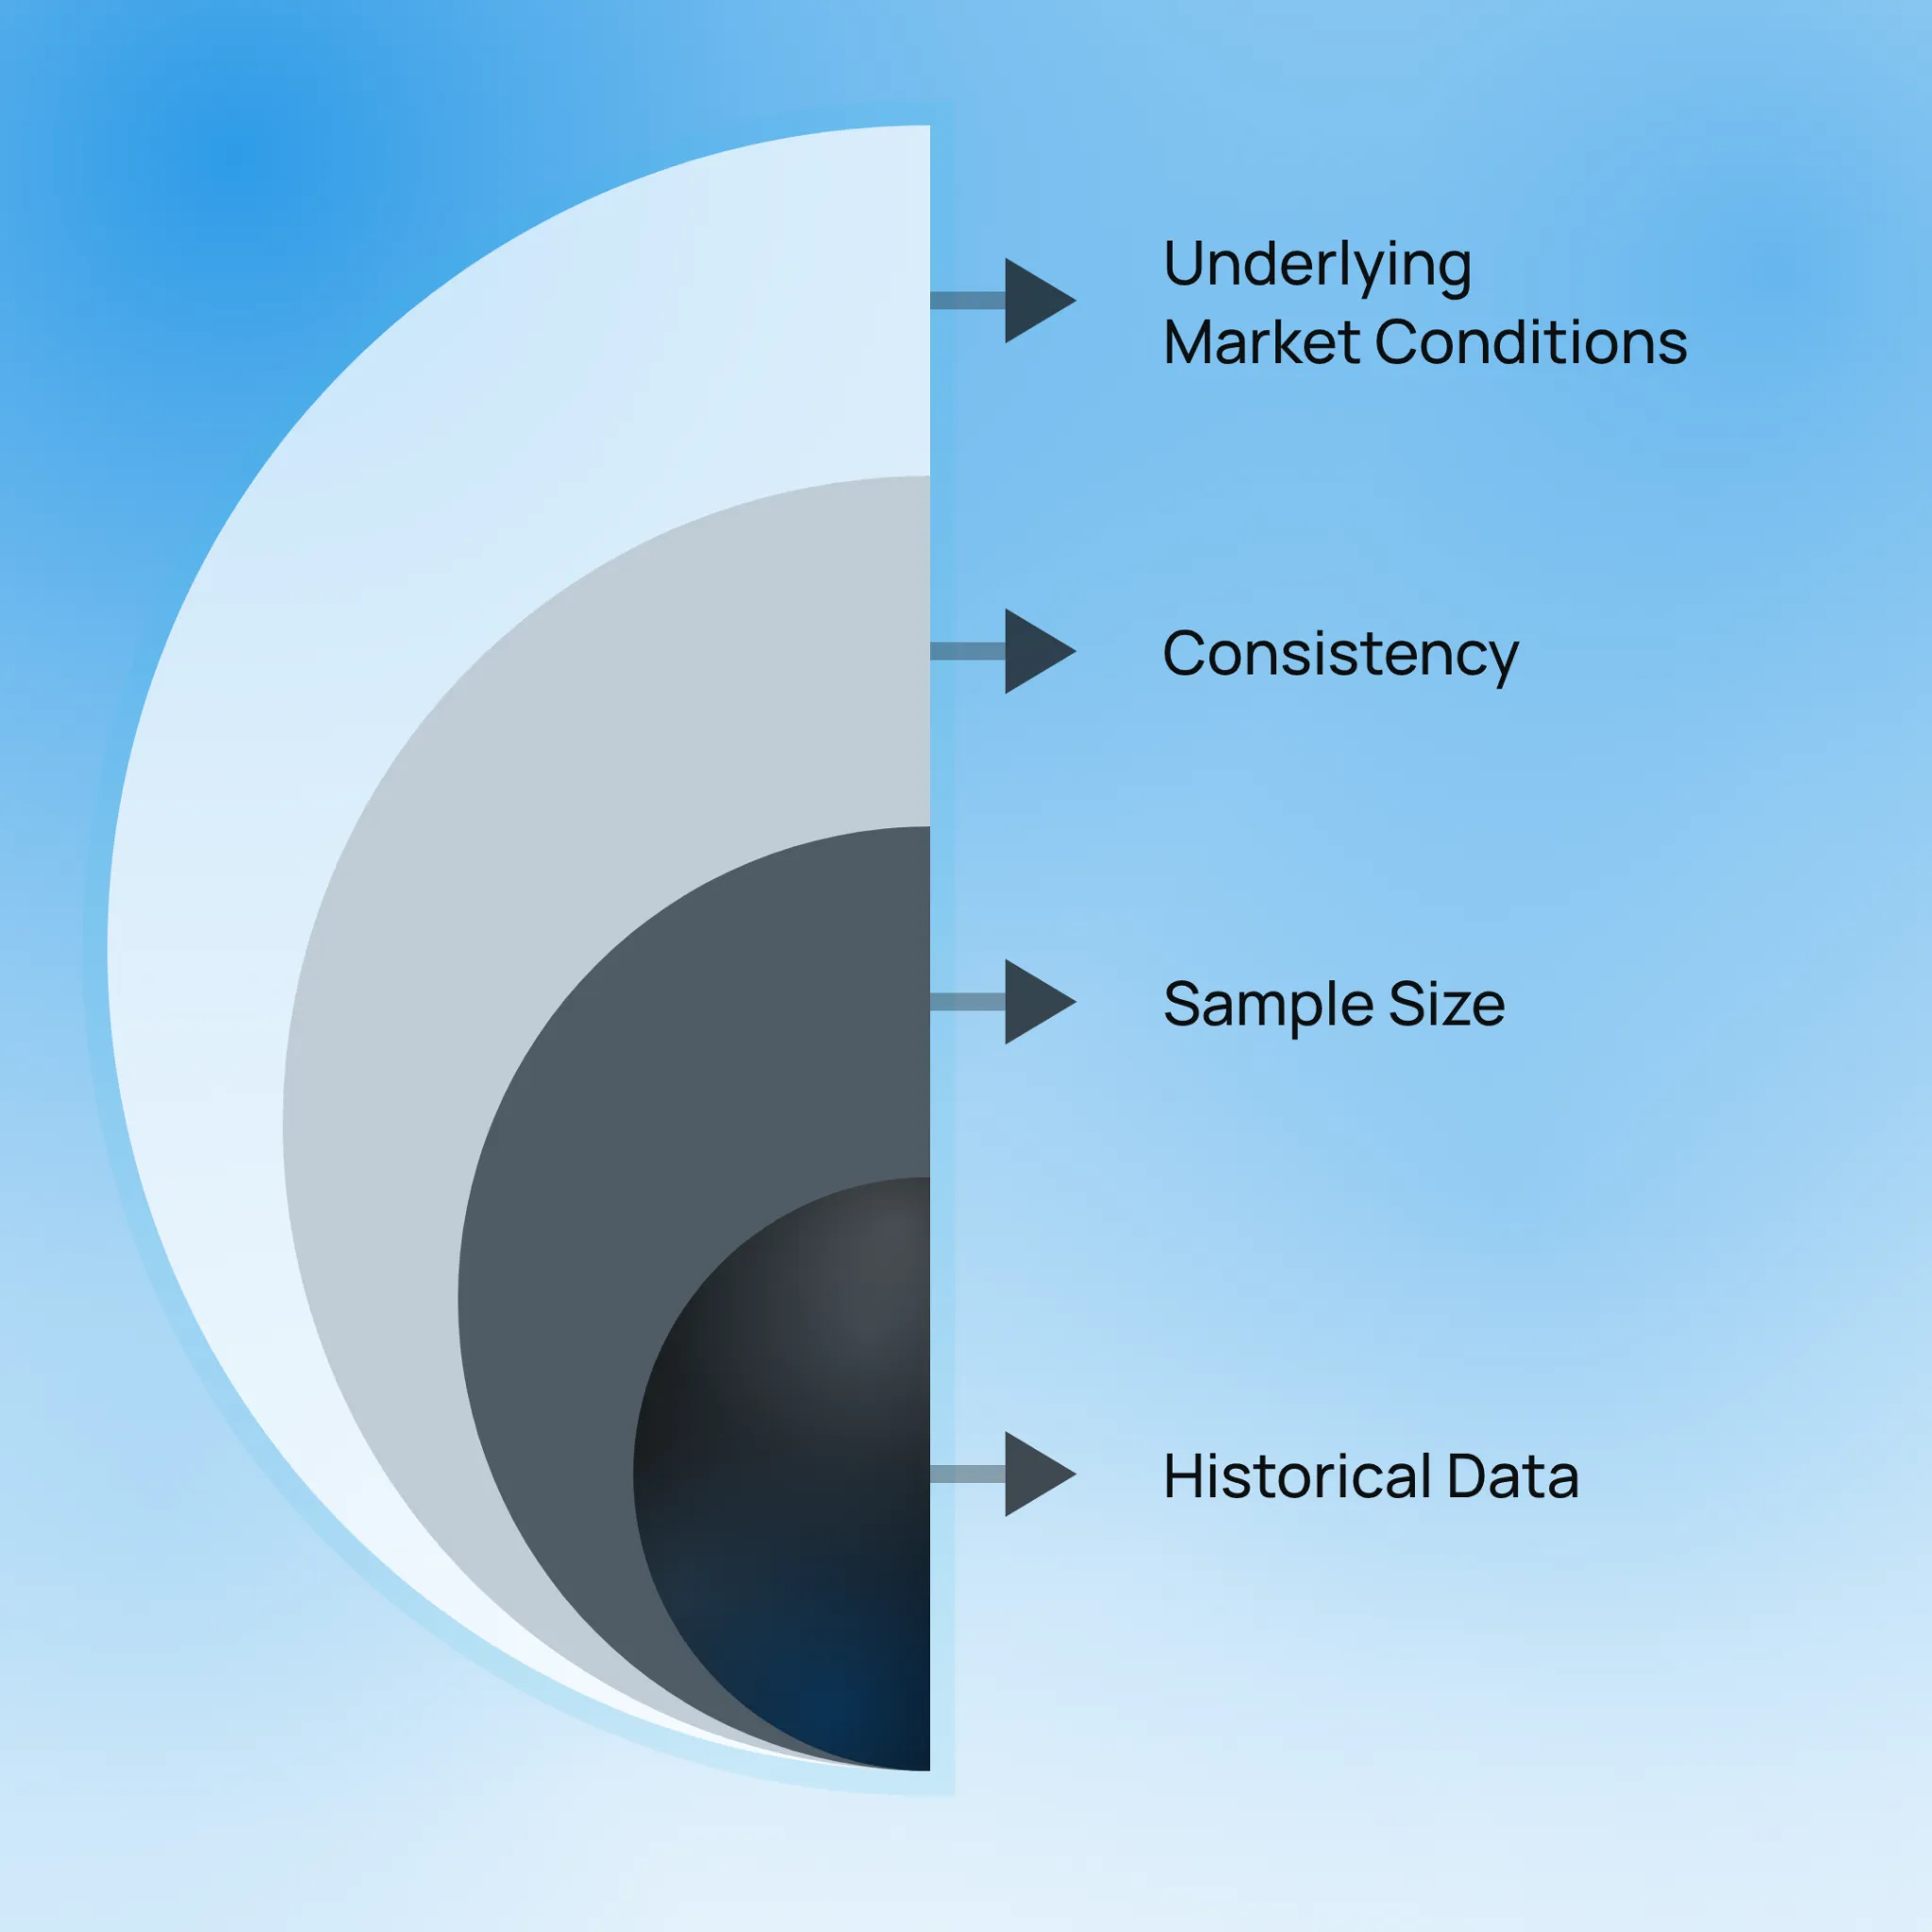
This approach also provides a better basis for evaluating “is seasonality real” in trading (than only relying on widely repeated market beliefs alone). A pattern is a starting point, not a confirmation. Explore Bookmap’s market visualization tools.
How to Check a Seasonal Claim Yourself
A seasonal trading pattern can be tested by comparing its historical performance across the same calendar period over many years. Below is a simple step-by-step process that can be followed to separate a recurring tendency from a pattern that appears only in a few years:
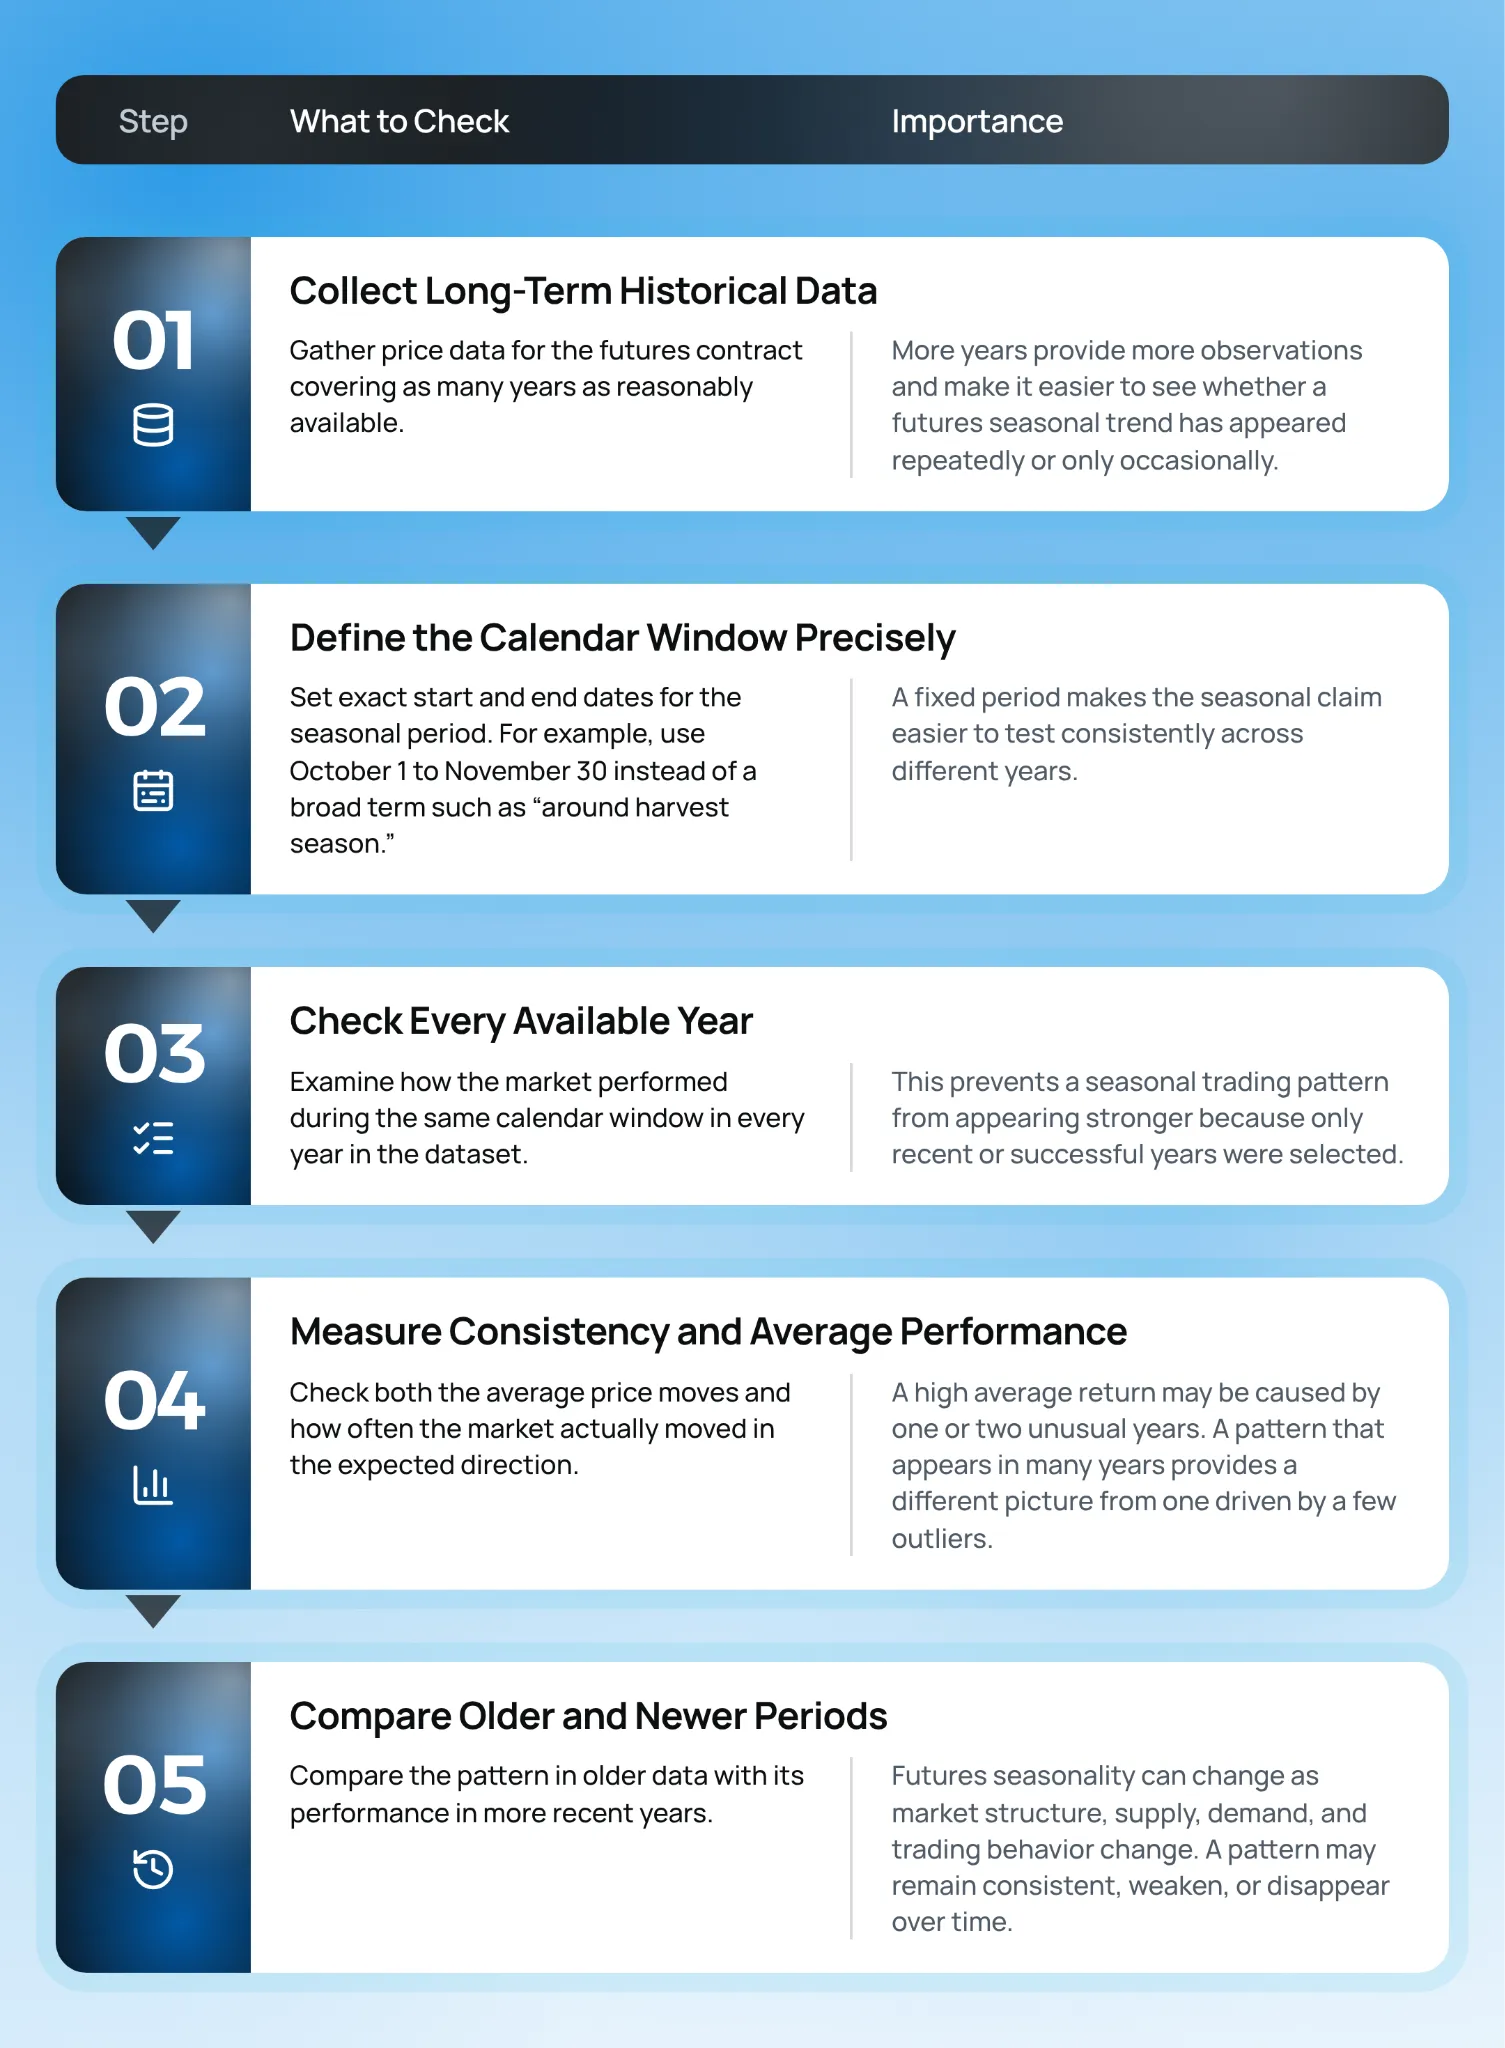
This process forms the foundation of how to backtest seasonality. It treats seasonality as a historical claim that requires evidence rather than assuming that every futures seasonal trend will continue in the same way.
Common Pitfalls That Make Seasonality Look Stronger Than It Is
Historical data can make futures seasonal trends appear stronger than they actually are when the testing process contains certain “biases.” Therefore, market participants must be aware of the following common pitfalls when evaluating seasonality in futures markets:
A) Cherry-Picking the Date Range
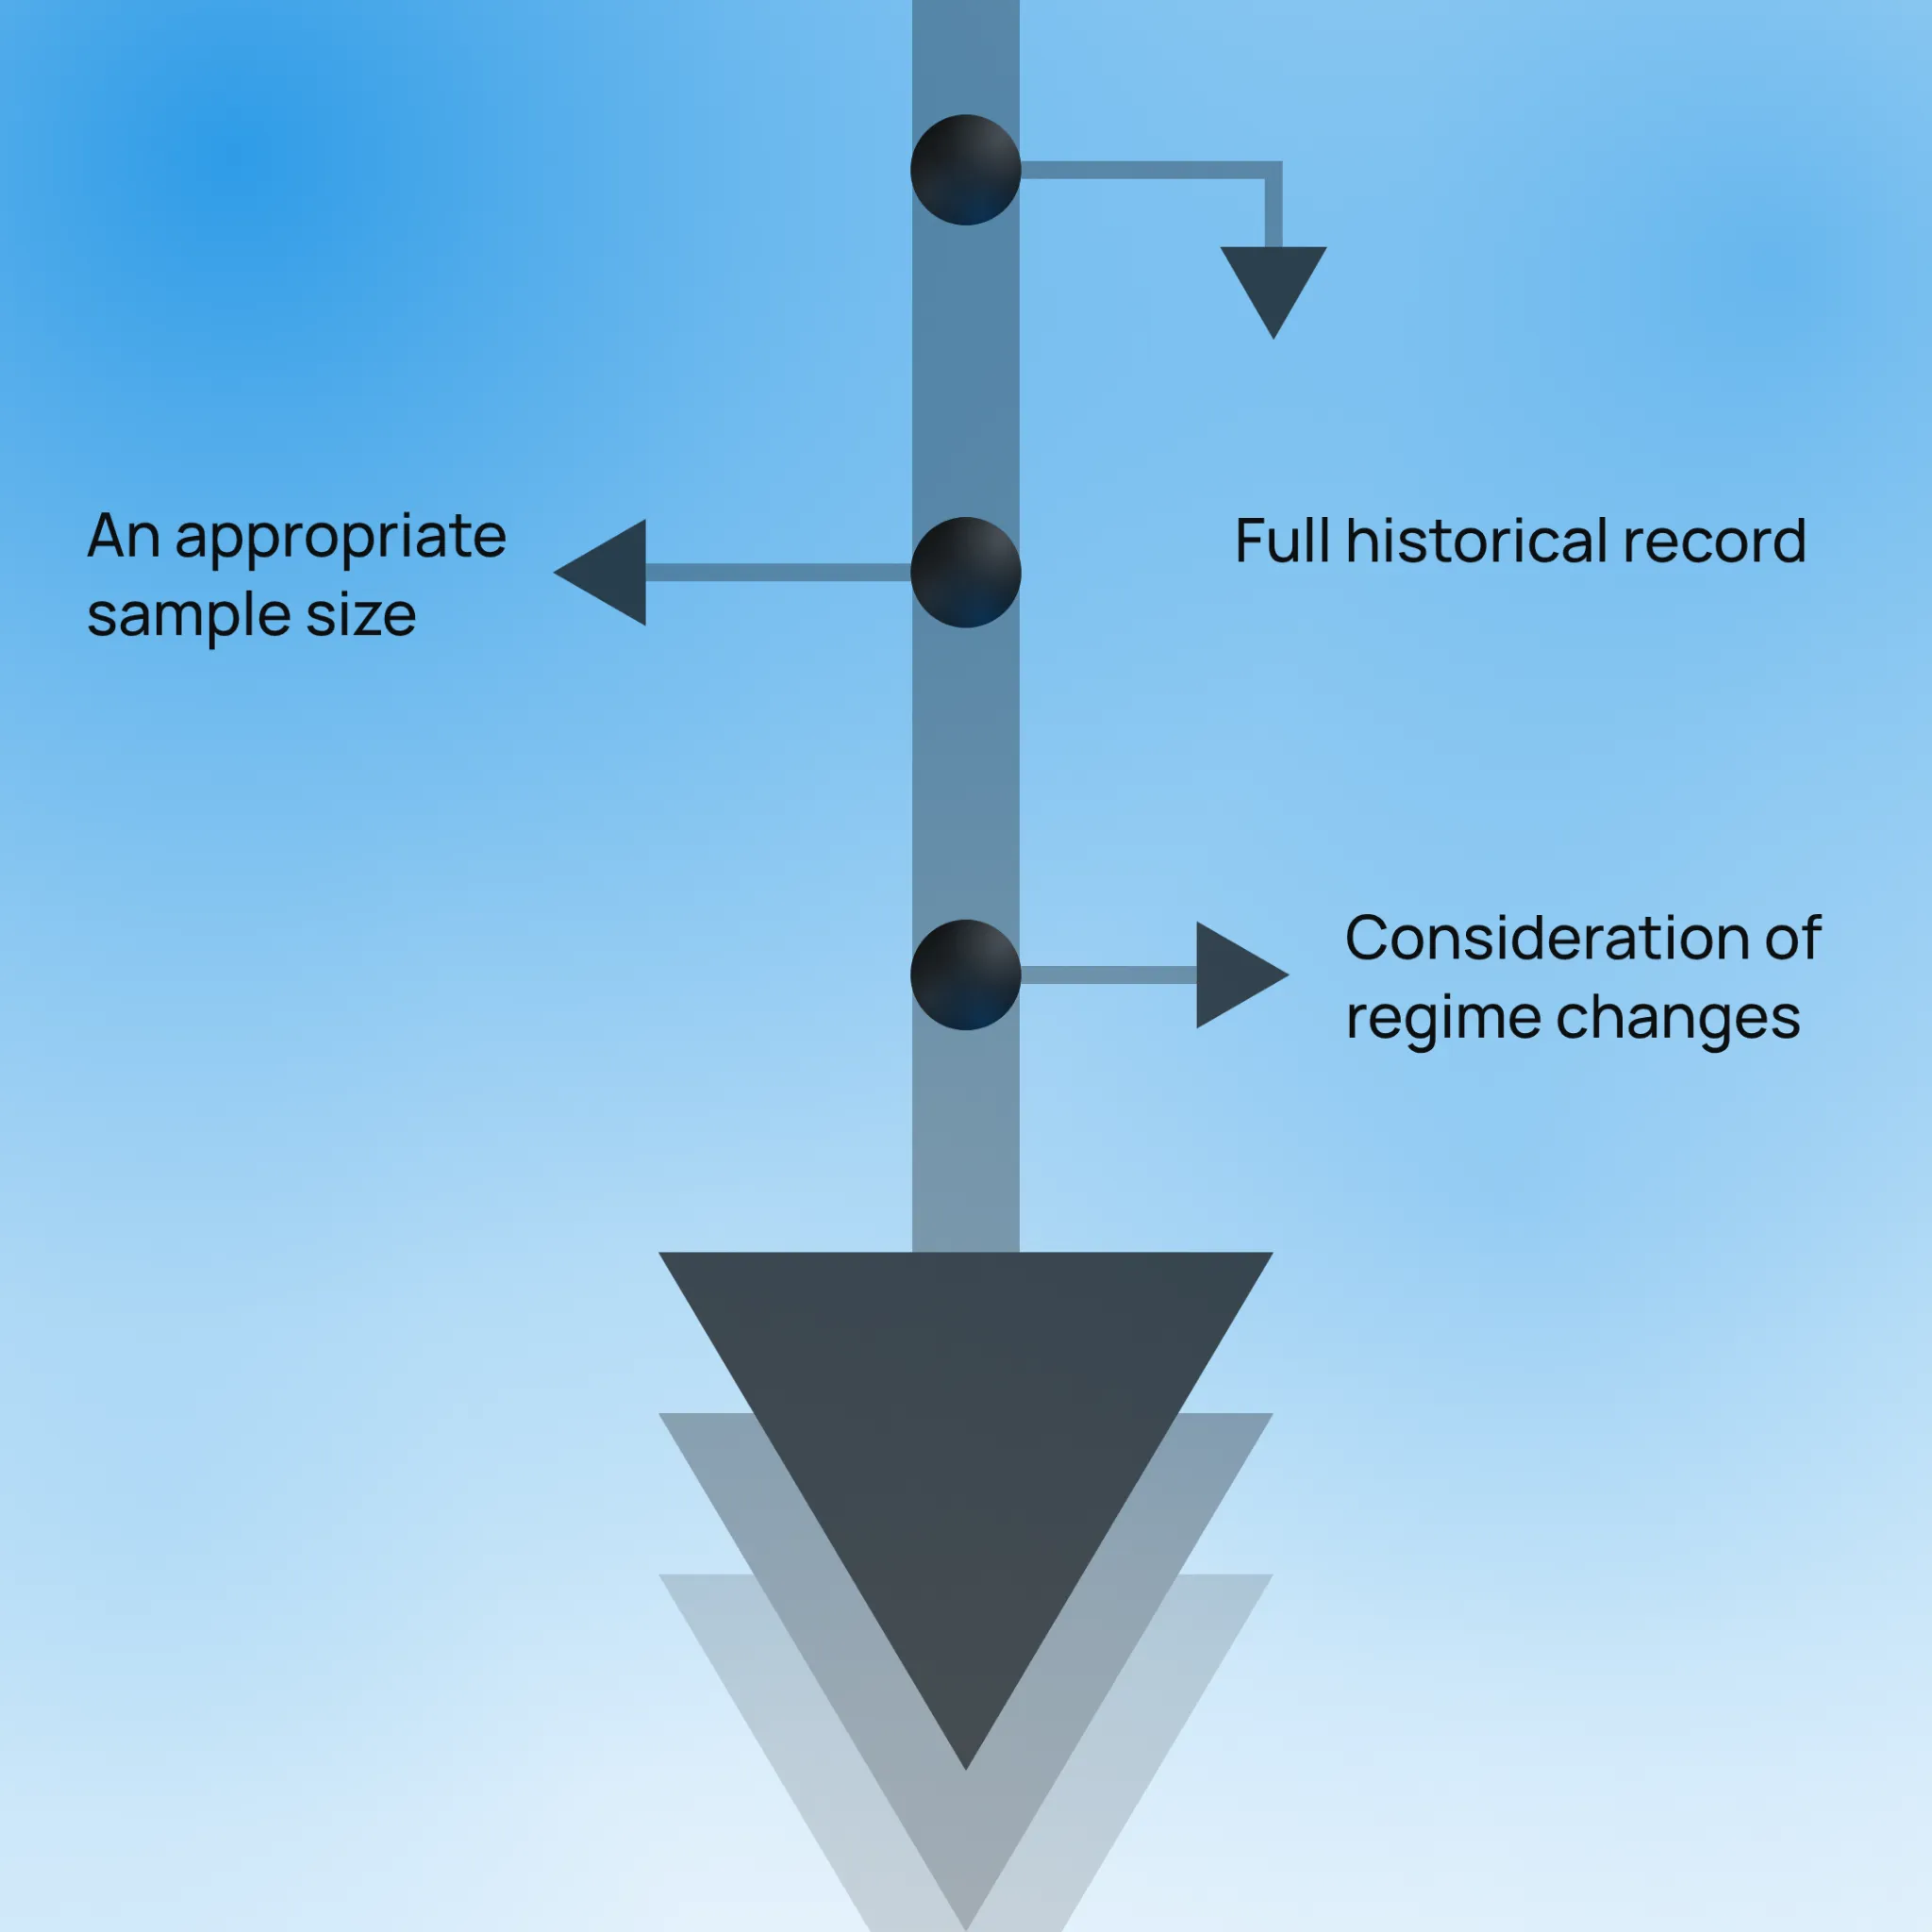
Cherry-picking the date range is one major problem. It refers to selecting only the years or calendar periods that support a seasonal trading pattern that makes the result fit a preferred narrative. A better approach is to examine the full available history using a predefined date range.
B) Ignoring Regime Changes
Ignoring regime changes can also distort the results. A seasonal effect may have developed under specific supply, demand, or market conditions that later changed. For example,
- Suppose a structural change in production or supply may reduce or remove a pattern that was visible in earlier decades.
C) Using a Small Sample
Small sample sizes create another issue. A pattern that appears over only five or six years provides limited evidence for futures seasonality. A few similar outcomes can occur by chance without representing a persistent seasonal tendency.
D) Remembering Only Successful Years
Finally, survivorship in repeated market claims can make a pattern seem stronger than the historical record suggests. Successful years are often mentioned and shared, while years when the pattern failed receive less attention.
As a result, the “remembered version” of a seasonal trading strategy may differ from what a complete historical test shows.
These pitfalls show the importance of backtesting seasonality. To make a thorough assessment and check whether seasonality is not an illusion, market participants may require the following:
Price shows what happened. Order flow can provide more clues about why. Compare Bookmap packages.
Why a Seasonal Tendency Isn’t a Trading Plan
Even a futures seasonal trend, completely supported by long historical data, is not a guarantee for the current year. Note that historical patterns describe what happened in the past, not what must happen this year.
A futures seasonal trend may have appeared consistently for many years because of a recurring factor such as:
- Harvest cycles,
- Winter demand, or
- Institutional flows.
However, the conditions underlying that pattern may differ in the current year. Weather, supply, demand, inventories, interest rates, economic conditions, or unexpected events can change the market’s behavior. For example,
- Suppose natural gas prices have usually risen historically during winter because of higher heating demand.
- But in the current year, an unusually mild winter or high gas inventories could produce a different price response.
So, even strong historical futures seasonality shows a tendency (they are not a certainty). Current market conditions still determine whether the historical pattern is actually playing out.
Therefore, a seasonal trading strategy should not treat historical patterns as certain predictions. Instead, seasonality can serve as a starting hypothesis that suggests a possible directional bias. The actual market behavior still needs to provide evidence that the historical tendency is developing again.
Confirming Whether a Seasonal Setup Is Actually Playing Out
Once a seasonal tendency has been identified, the next step is to examine whether current market behavior is consistent with that historical pattern. This is where Bookmap can add another layer of market analysis by showing what is happening in the order book and order flow during the relevant calendar window.
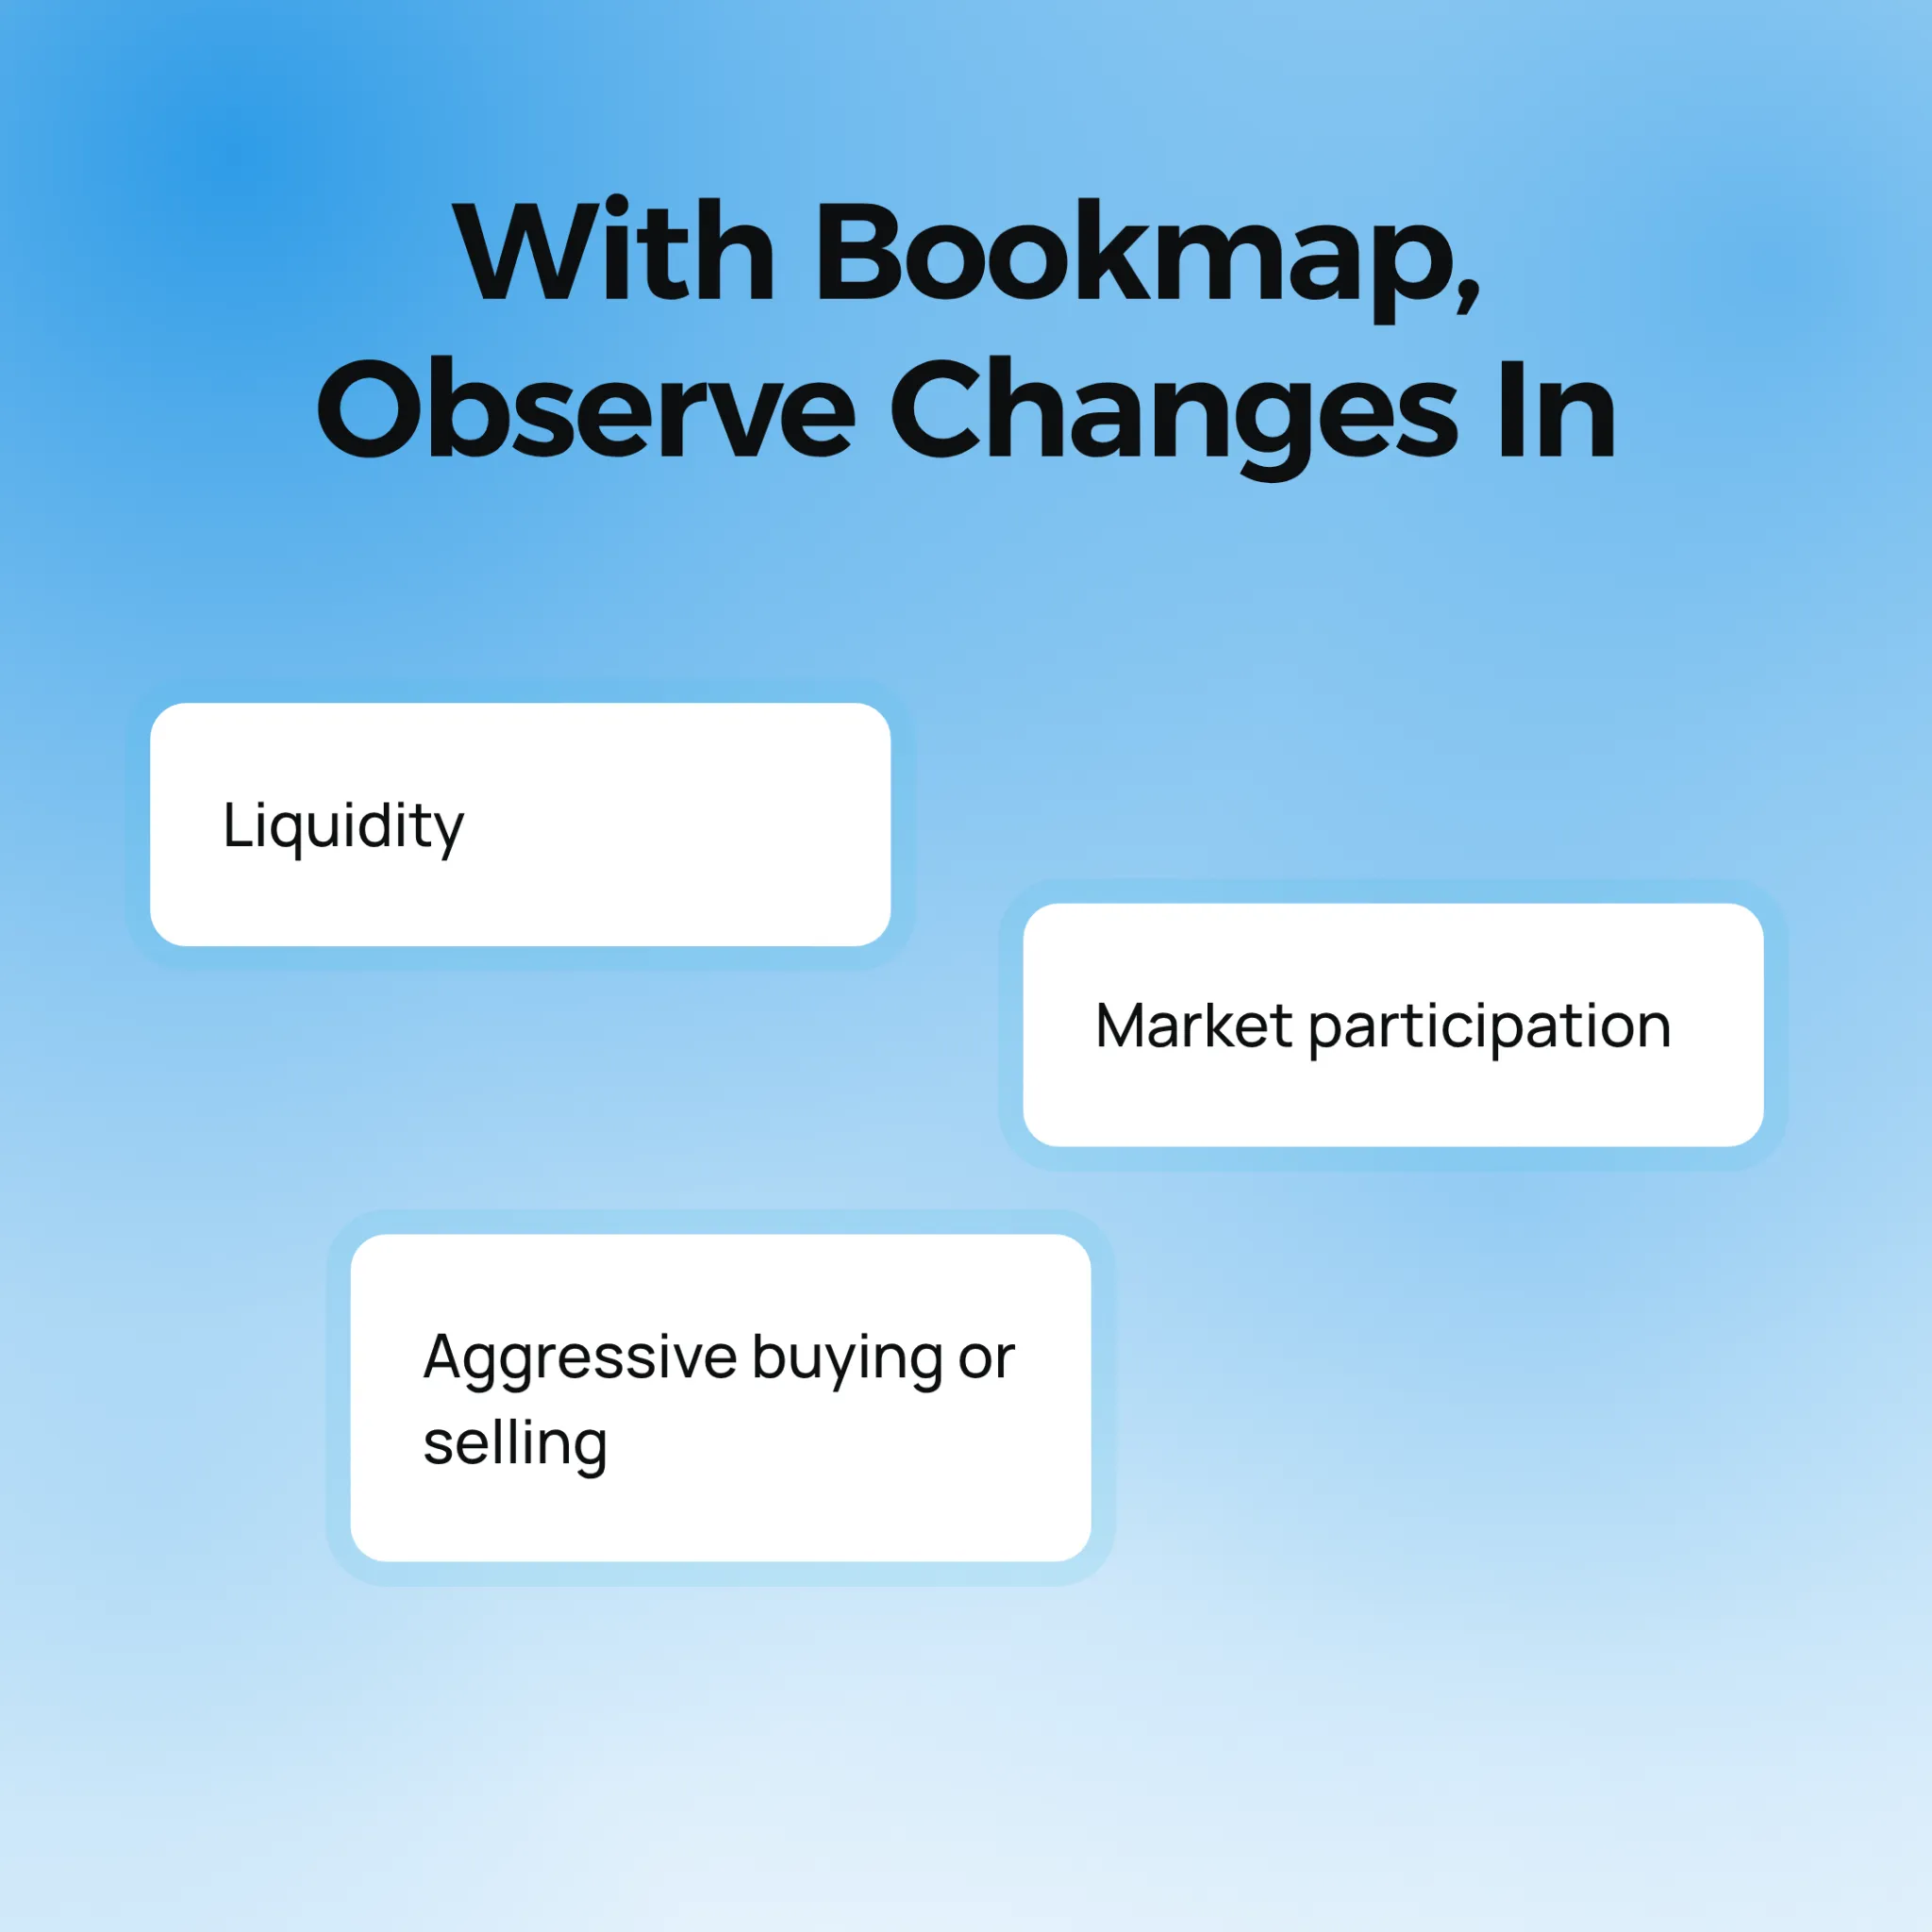
Thus, seasonality in futures markets provides a lead worth investigating rather than a signal to follow on faith. The calendar identifies a historical tendency, while knowledge of current market behavior (gained through Bookmap) provides additional evidence about whether that tendency is actually developing.
Conclusion
Seasonality in futures markets can reveal recurring patterns, but not every seasonal claim has the same level of support. Some futures seasonal trends have persisted for many years and have logical economic drivers. In contrast, others may appear strong only because of a small sample, selected dates, or a few unusual years.
Therefore, each claim needs to be tested against the full historical record. Furthermore, Futures seasonality can serve as a useful starting hypothesis, but it does not guarantee a particular market outcome.
Historical patterns also need to be compared with current market behavior. Order flow, liquidity, and buying or selling activity can provide additional context on whether a seasonal setup is developing in the current market.
This makes seasonality a research tool rather than a standalone trading signal. Good trading decisions start with better evidence. See how Bookmap helps traders observe liquidity and order flow in real time.
FAQs
1. Is seasonality in futures markets real?
Yes, some forms of seasonality in futures markets have shown recurring patterns over long periods. For example,
- Agricultural futures can be affected by regular planting and harvest cycles that influence supply.
However, not every seasonal claim has strong evidence. Some patterns may weaken over time or appear strong only because of a few unusual years. Therefore, futures seasonality needs to be tested using historical data.
2. How many years of data are needed to confirm a seasonal pattern?
There is no fixed number of years that can confirm a seasonal pattern. However, five or six years generally provide too few observations to establish a strong historical tendency. A longer history gives a better view of:
- How often the pattern appeared
and
- Whether it remained consistent across different market conditions
As a result, how to backtest seasonality comes down to using as much relevant historical data as reasonably available and examining both consistency and the size of price moves.
3. What’s the difference between a real seasonal pattern and a coincidence?
A recurring seasonal pattern may appear across many years rather than only during a few successful periods. It may also have a logical market driver, such as:
- Changes in agricultural supply or seasonal energy demand.
In contrast, a “coincidence” may result from a small number of unusual years. For example, if a market rises during the same calendar period in four out of five years, that alone does not establish a dependable seasonal trading pattern.
A broader historical sample generally provides stronger evidence.
4. Can seasonality alone be used as a trading strategy?
Seasonality is generally better viewed as a “historical hypothesis” than as a complete seasonal trading strategy. A seasonal pattern may indicate that a particular market has tended to move in one direction during a specific period. Still, it cannot guarantee the same outcome in the current year.
Current supply, demand, economic conditions, liquidity, and market participation can differ from previous years. Therefore, seasonal analysis can identify a period worth examining, while current market behavior can provide additional evidence before making a trading decision.
5. Why do seasonal patterns sometimes stop working?
Seasonal patterns can weaken or disappear when the conditions that created them change. For example,
- A supply cycle may change because of new production methods.
- There could be changes in inventories, trade flows, or shifts in demand.
- Market structure can also change as participants, technology, and trading activity evolve.
Consequently, a pattern that appeared consistently for many years may no longer produce the same result. Thus, market participants may conduct “periodic testing” of futures seasonal trends against newer data (rather than treating them as permanent market characteristics).
 Twitter
 Facebook