
Time and Sales vs. Heatmap: Reading the Tape Two Ways
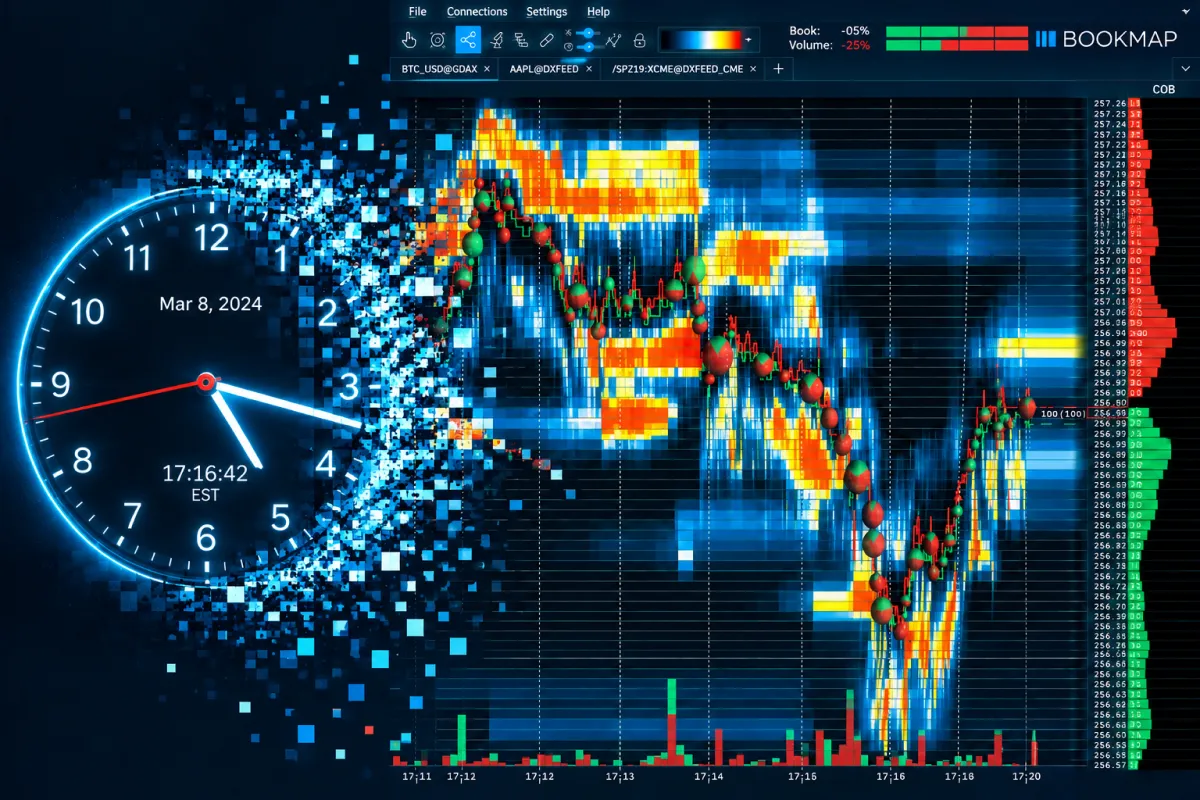
The same market can tell two different stories, depending on where the eyes are placed. One trader watches a scrolling tape and sees a rapid sequence of large trades; another studies a heatmap and sees those trades meeting a wall of resting liquidity.
Neither view is necessarily wrong. They simply observe different parts of the same market. This difference matters. Traditional tape reading or time and sales trading records what has already happened. On the other hand, a heatmap shows the liquidity conditions surrounding those transactions. Together, they offer a broader view of market behavior than either tool alone.
Read this article to learn the difference between “time and sales vs heatmap”, what each tool shows, where their readings diverge, and how they complement each other.
Two Different Ways of Recording the Same Market
Time and sales records trades that have already been executed. Each transaction appears in sequence with its:
- Time,
- Price, and
- Size.
Such sequential data creates a historical record of what actually occurred in the market. This makes the time and sales window a “transaction log” that shows how buying and selling took place at specific moments.
In contrast, a heatmap shows the liquidity available in the order book. It displays where resting buy and sell orders sit at different price levels and how that liquidity evolves over time. Executed trades can also appear on the heatmap, linking those actual transactions to the liquidity around them.
Therefore, comparing time and sales vs heatmap is not a choice between two competing versions of the same tool. Instead, they provide two different views of the same market.
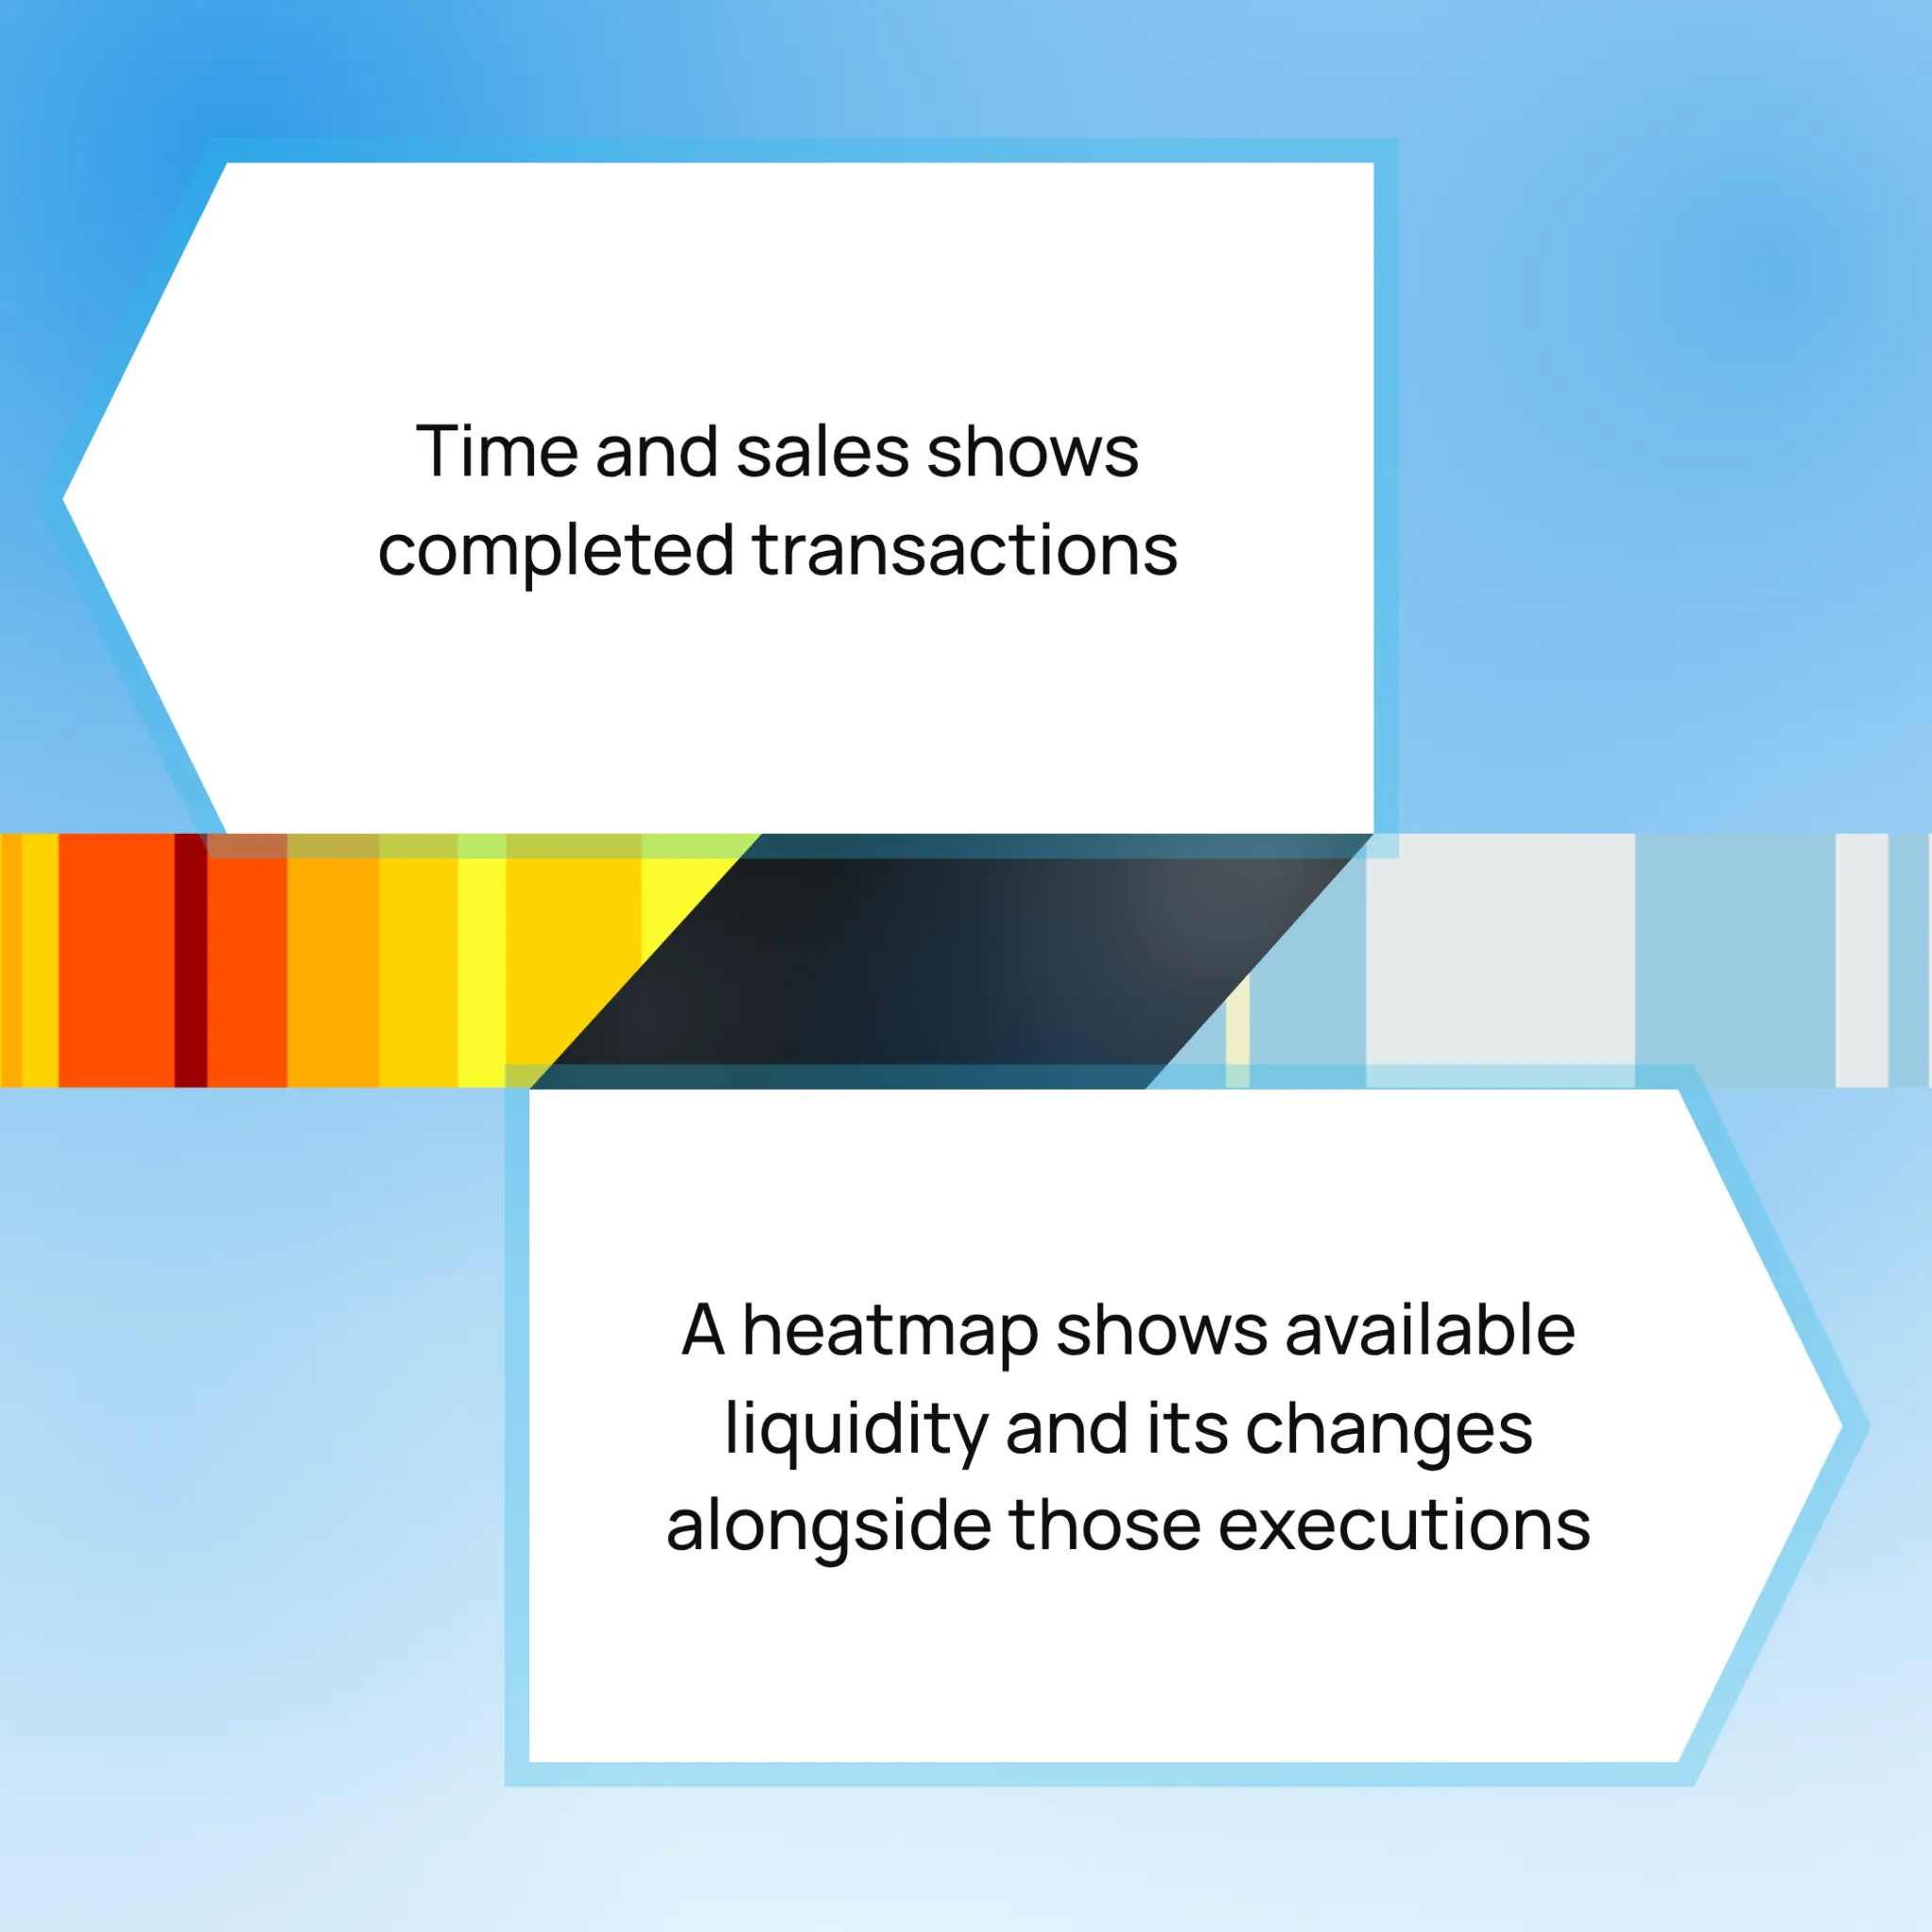
In this way, one lens records what happened, while the other shows the liquidity environment in which it happened.
What Time and Sales Actually Shows You
Time and sales display individual executed trades (usually called “prints”) in the order they occur. Each print shows important information such as:
- The execution price
- Trade size
- Time
The print also records these transactions in their “sequence”, which indicates the pace at which transactions are taking place. The speed of the prints provides a rough indication of market activity. Let’s see how:
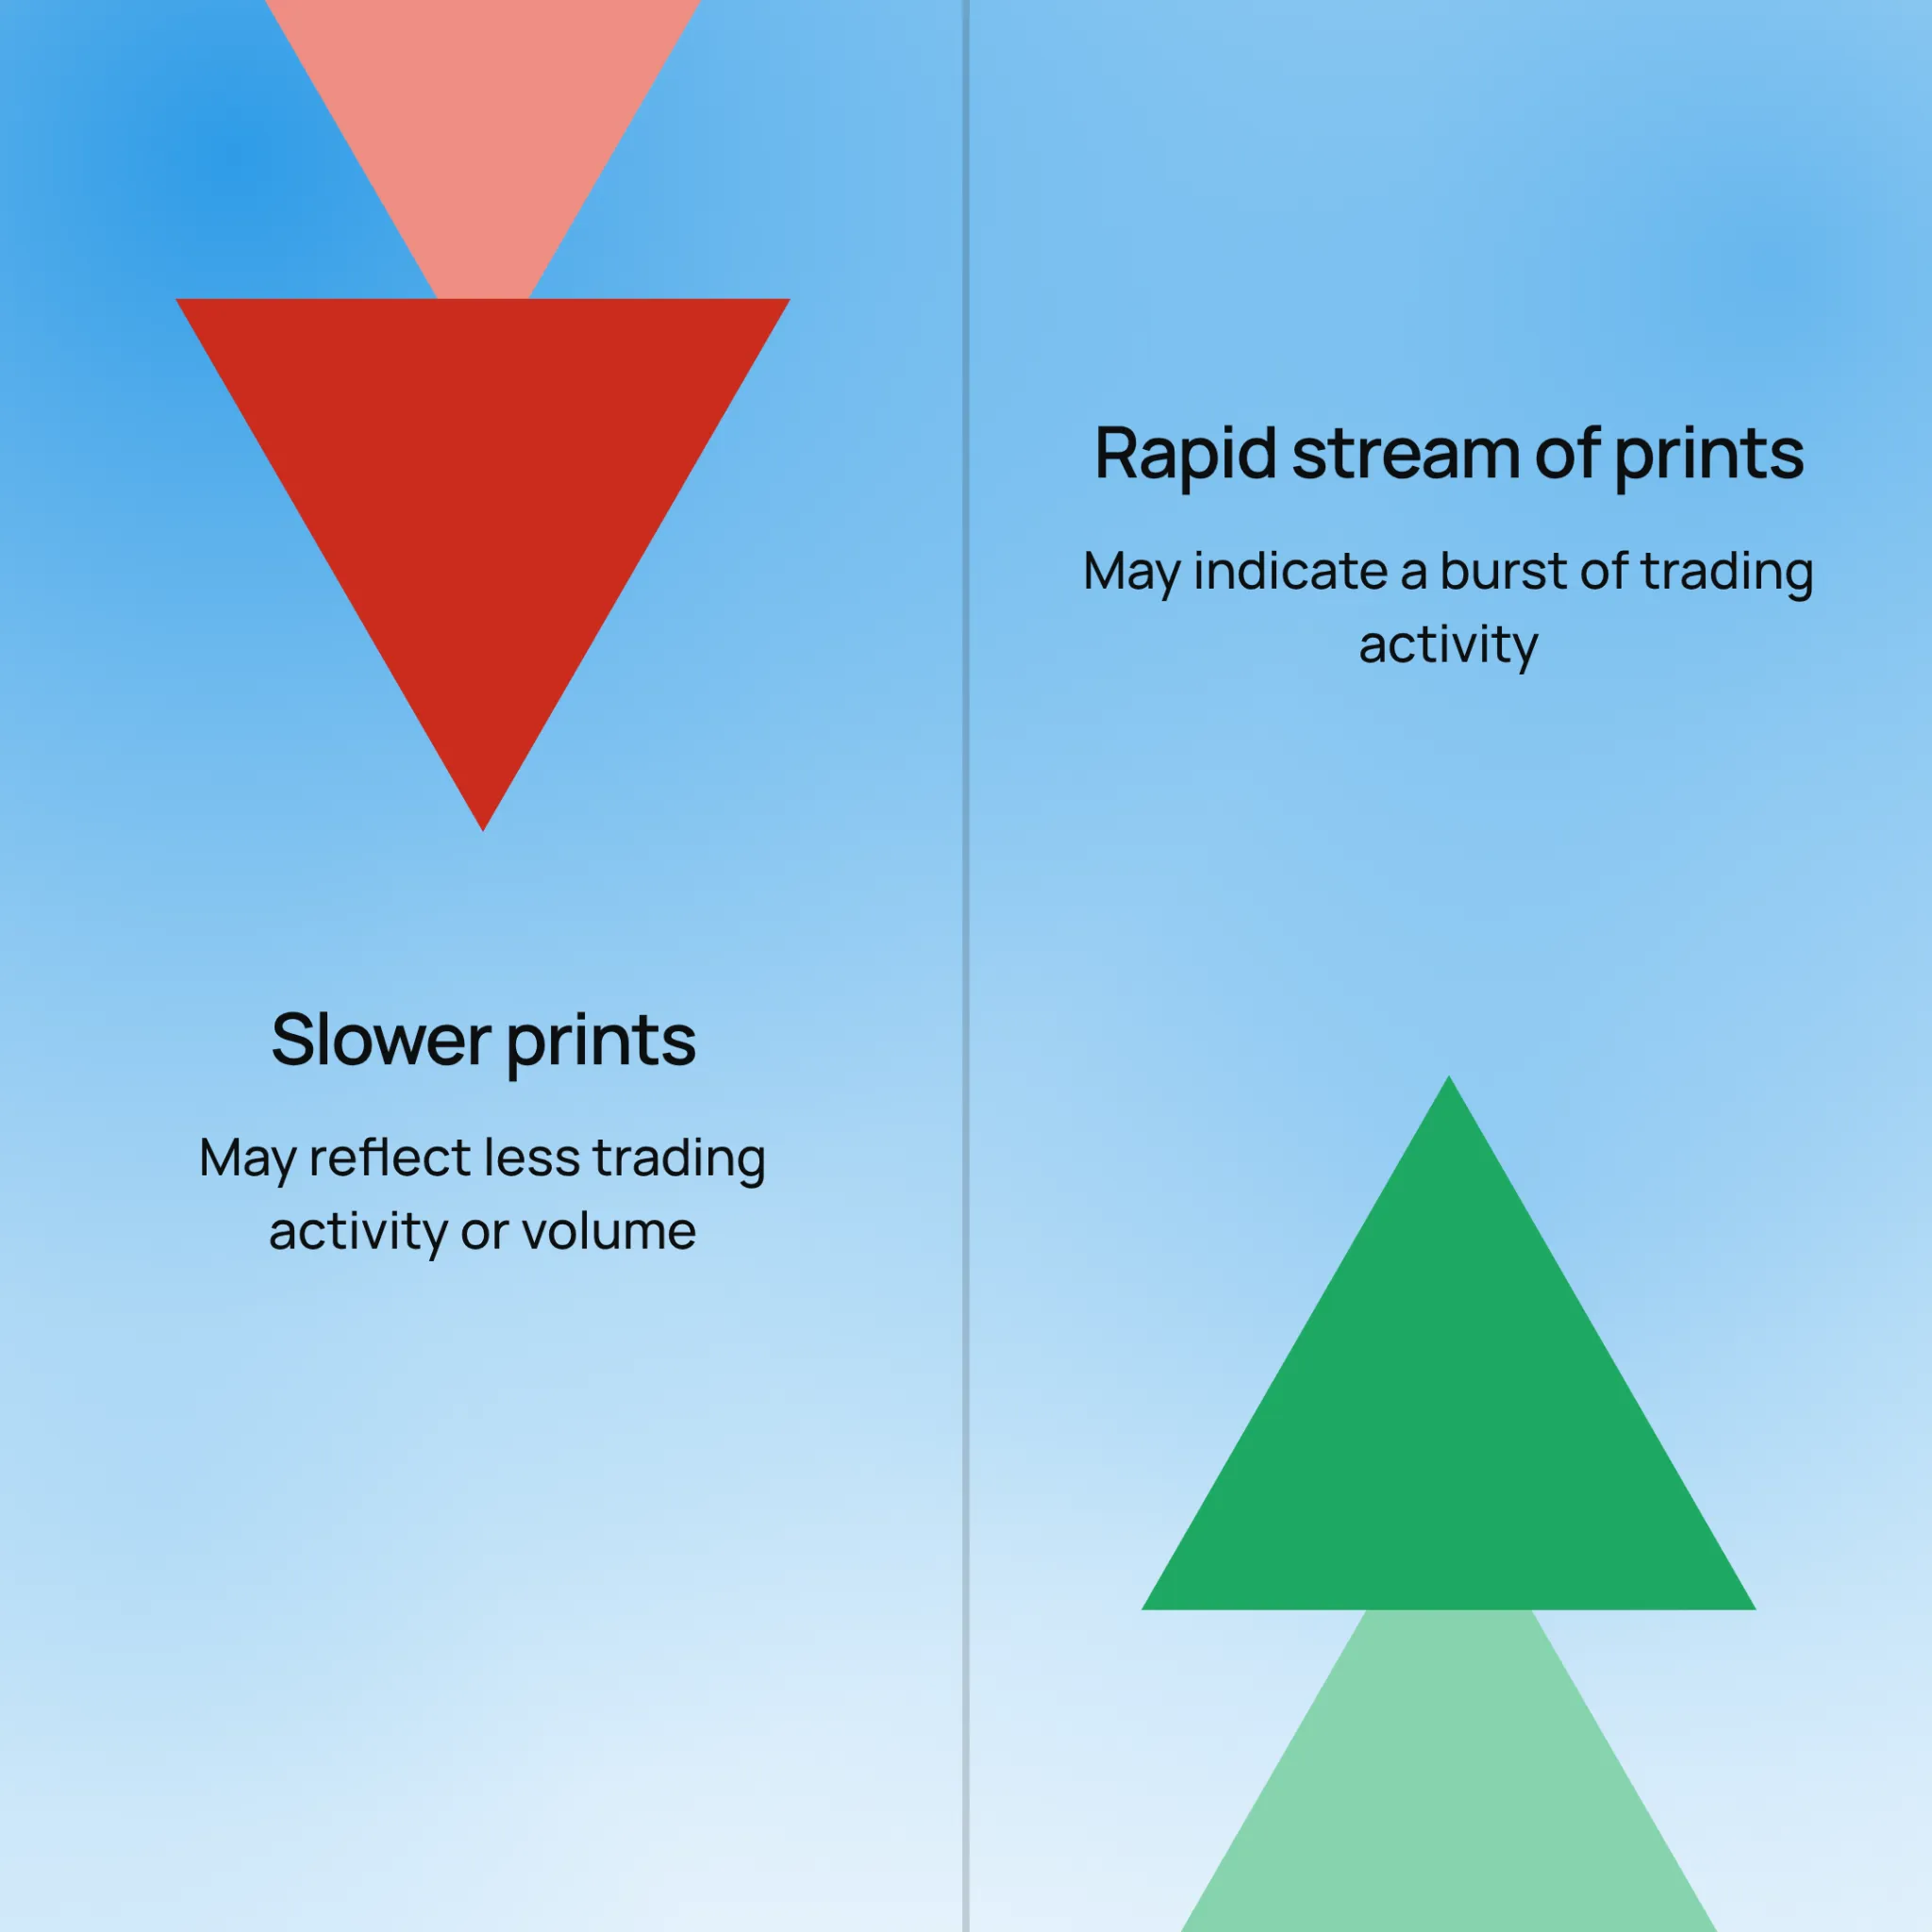
The tape also shows whether trades are hitting the bid or lifting the offer. Such an observation may help in identifying whether aggressive selling or buying is taking place. As a result, a time and sales window confirms that trading is actually taking place, rather than just analyzing displayed quotes.
Besides, it can also reveal bursts of aggressive activity and changes in trade size and pace. These observations form an important part of reading the tape and broader order flow analysis.
However, time and sales has an important limitation. It records only executed trades ,and not resting liquidity. Additionally, it does not show:
- The volume of liquidity available around the trade
- Whether the orders being hit were thin or deep, or
- The orders waiting above or below the current price.
That information requires a view of market depth or a heatmap.
Furthermore, if we again talk about the positives, time and sales can also reveal different aspects of the price structure through the sequence of executions. For example,
- A trader observing time and sales can spot repeated tests of a price level, such as a “triple bottom”.
- That pattern would appear on the tape as a sequence of prices testing the same level, followed by prints at progressively higher prices after the bounce.
- However, those prints only provide the numerical record of the event.
A heatmap adds the surrounding “liquidity context” to that same price structure. Using it, market participants can make two important observations:
| Level of Resting Orders | Liquidity Changes |
|
|
In this way, time and sales show what traded, while a heatmap adds context about the liquidity present around those trades. See both views side by side instead of switching between windows. Explore Bookmap’s market visualization tools.
What a Heatmap Actually Shows You
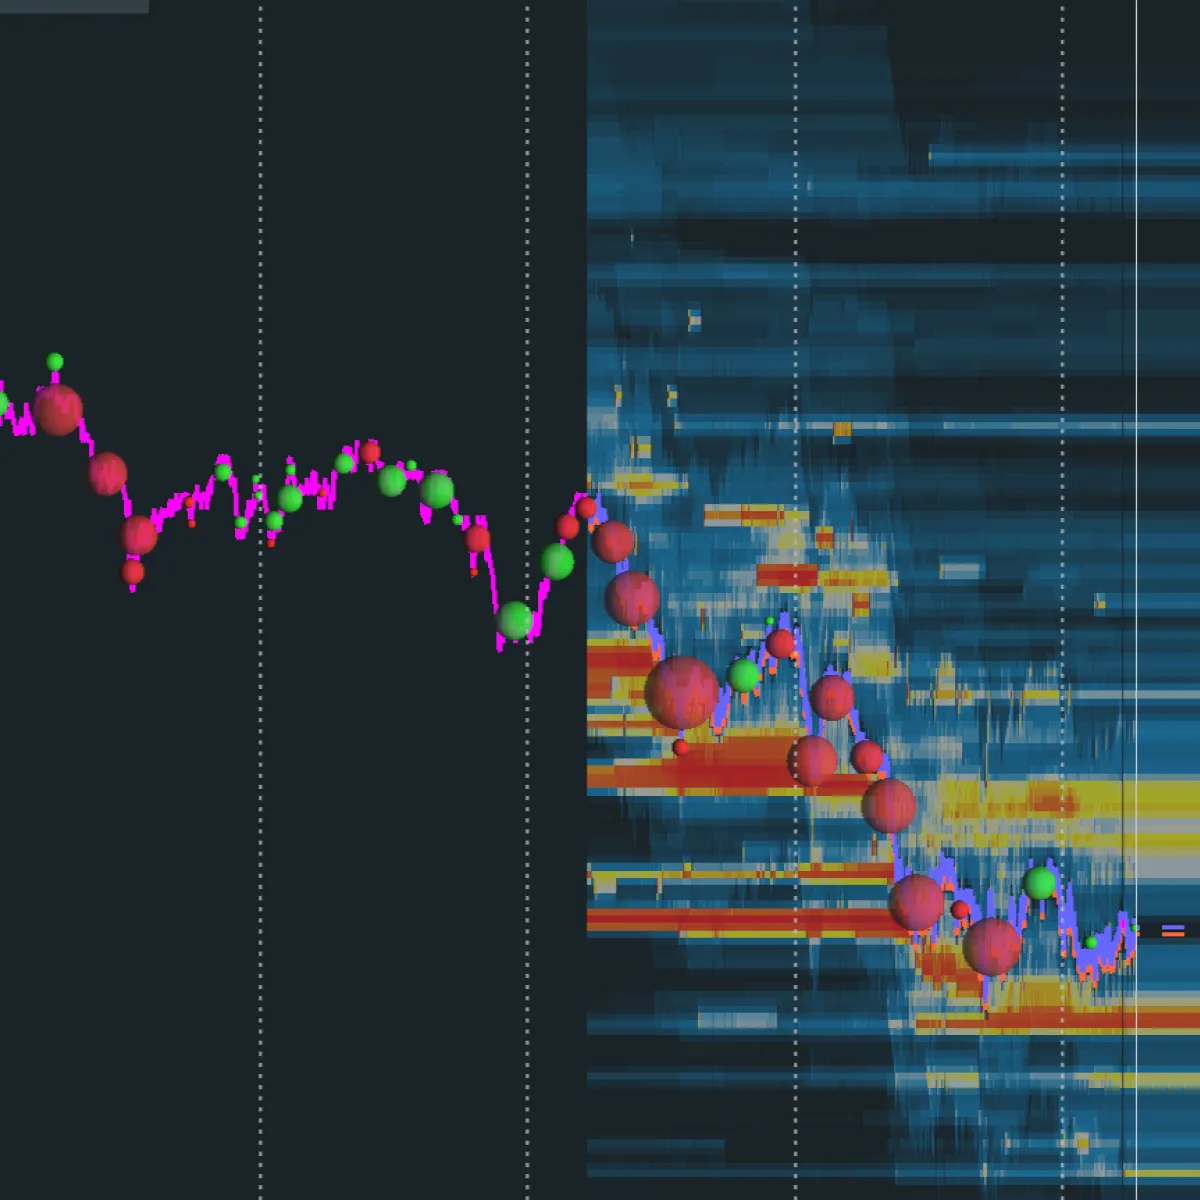
A heatmap provides a visual and historical view of resting orders across different price levels. As the market changes, the heatmap records how liquidity is added, pulled, or consumed. Such a recording creates a picture of how the order book develops over time.
A trader using a heatmap can:
- See where large amounts of liquidity are building before price reaches a level.
- Understand how that liquidity behaves when price arrives.
For example, a trader can easily observe on a heatmap how a large liquidity area may remain in place and get absorbed by incoming orders, or a level that appeared strong may suddenly become thinner as resting orders are removed.
Additionally, a heatmap also layers executed volume over the resting-liquidity view. As a result, both the liquidity that was available and the trades that occurred around it can appear within the same visual field. This can make a heatmap appear to perform some of the functions associated with time and sales trading.
However, the primary difference lies in “how the information is presented”. Time and sales is a scrolling transaction log that records trades in sequence. In comparison, a heatmap places liquidity and executions directly across price levels and time. This spatial view provides market-depth context that a tape alone does not show.
Where the Two Views Actually Diverge
The difference between time and sales vs heatmap becomes obvious when the same market event is viewed through both tools. That’s because:
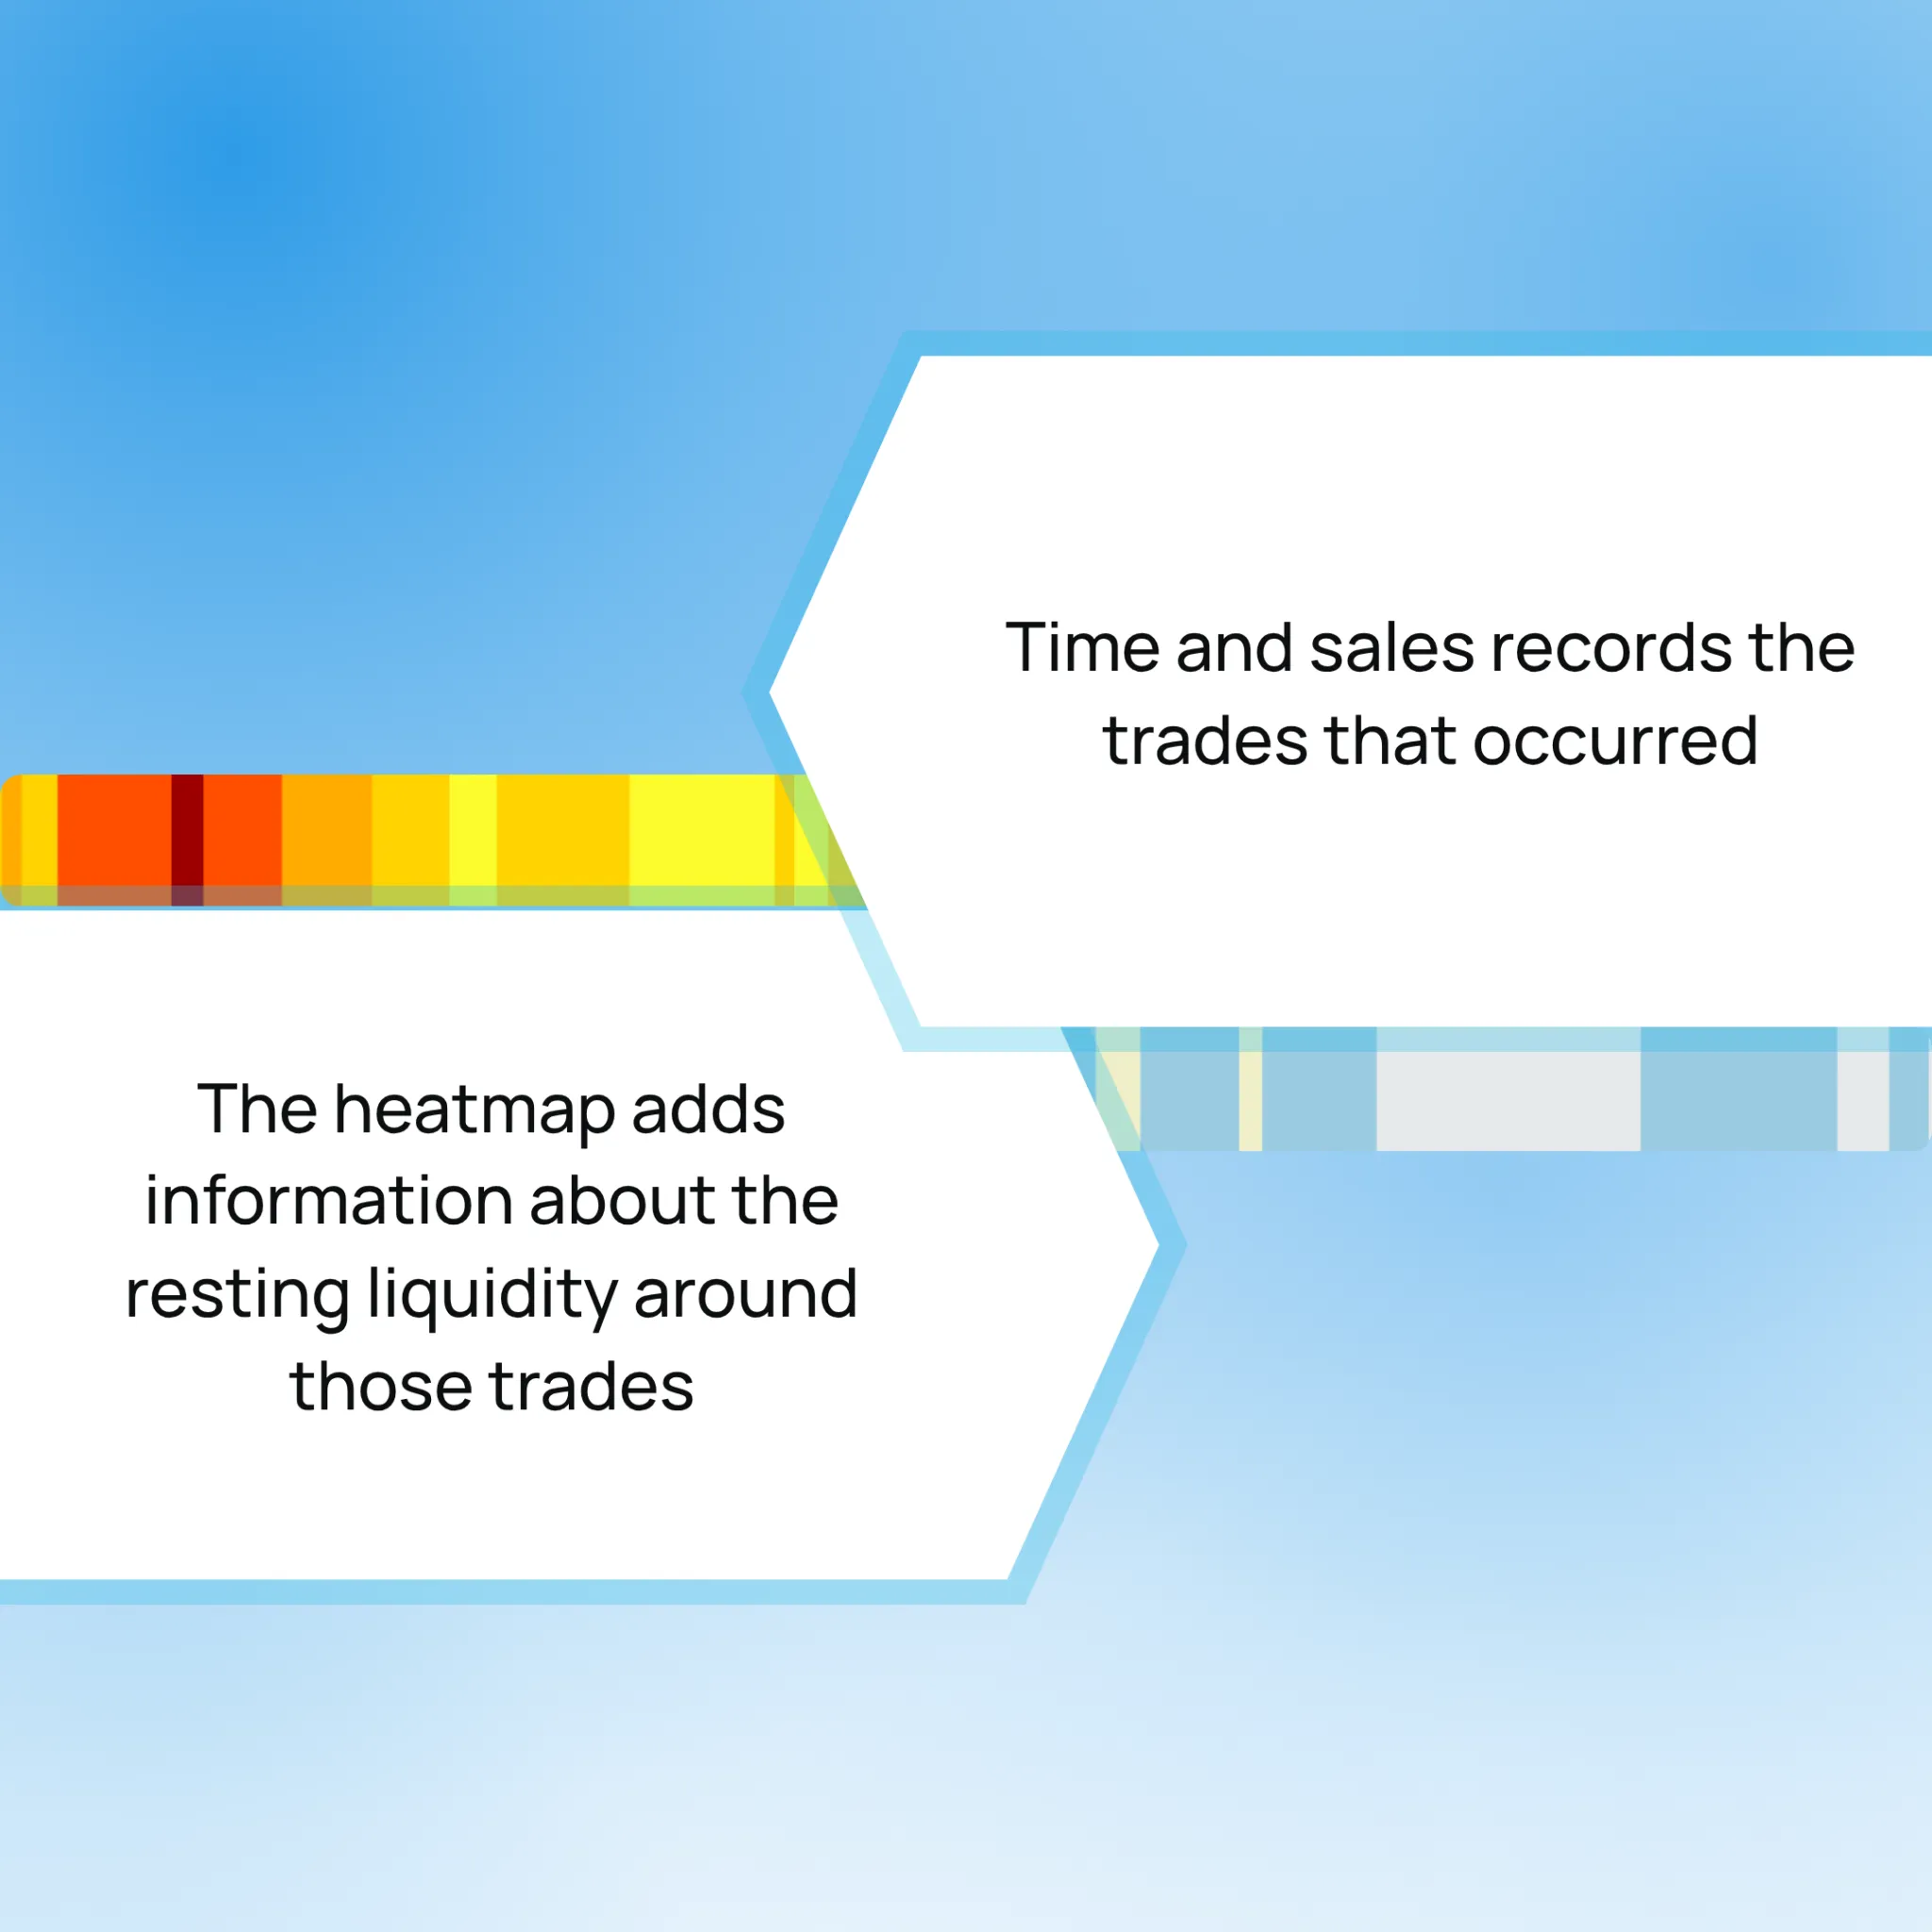
As a result, the same price action can carry a different meaning when both views are considered. Let’s understand the concept in detail through different market scenarios:
| Market Scenario | Time and Sales Alone Suggest | What the Heatmap Adds |
| Fast Burst of Prints at the Offer | Aggressive buyers are active, which may indicate buying momentum. | It shows whether those trades are being absorbed by large resting sell orders or moving through relatively thin liquidity. |
| Price Stalls With No Big Prints | Trading activity appears quiet, with little happening on the tape. | A large resting order may be positioned just ahead of price. This limits further movement despite the lack of large executed trades. |
| A Level Holds During a Fast Move | The level may appear to be ordinary support based on the executed trades. | The heatmap may show that liquidity had been building at that price for several minutes before the market reached it. This information can provide context for why the level held. |
| Price Breaks a Level Cleanly | The tape shows a clear breakout as trades move through the level. | The heatmap may reveal that resting liquidity had already thinned before the break. |
These examples show why reading the tape alone can leave out important information. For example, a burst of aggressive buying may confirm that buyers are executing at the offer, but it does not show whether a large seller is absorbing those trades.
Likewise, a lack of large prints does not always mean that the market is inactive. A substantial resting order can sit near the current price and restrict movement without generating significant executed volume until incoming orders reach it.
The same principle applies to price structure. Time and sales only show the sequence of transactions that form a price level or turn into a breakout. It is the heatmap that adds the liquidity context to that price action.
This combination of both tools gives a broader view of order flow, as executed trades and resting market depth can be examined together rather than as separate pieces of information. Price shows what happened. Order flow can provide more clues about why. Compare Bookmap packages.
Where They Overlap and Reinforce Each Other
Time and sales works alongside a heatmap; they are not competing tools. Instead, they show different parts of the same market activity. Thus, combining both views can provide more context than either one alone. Let’s understand why:
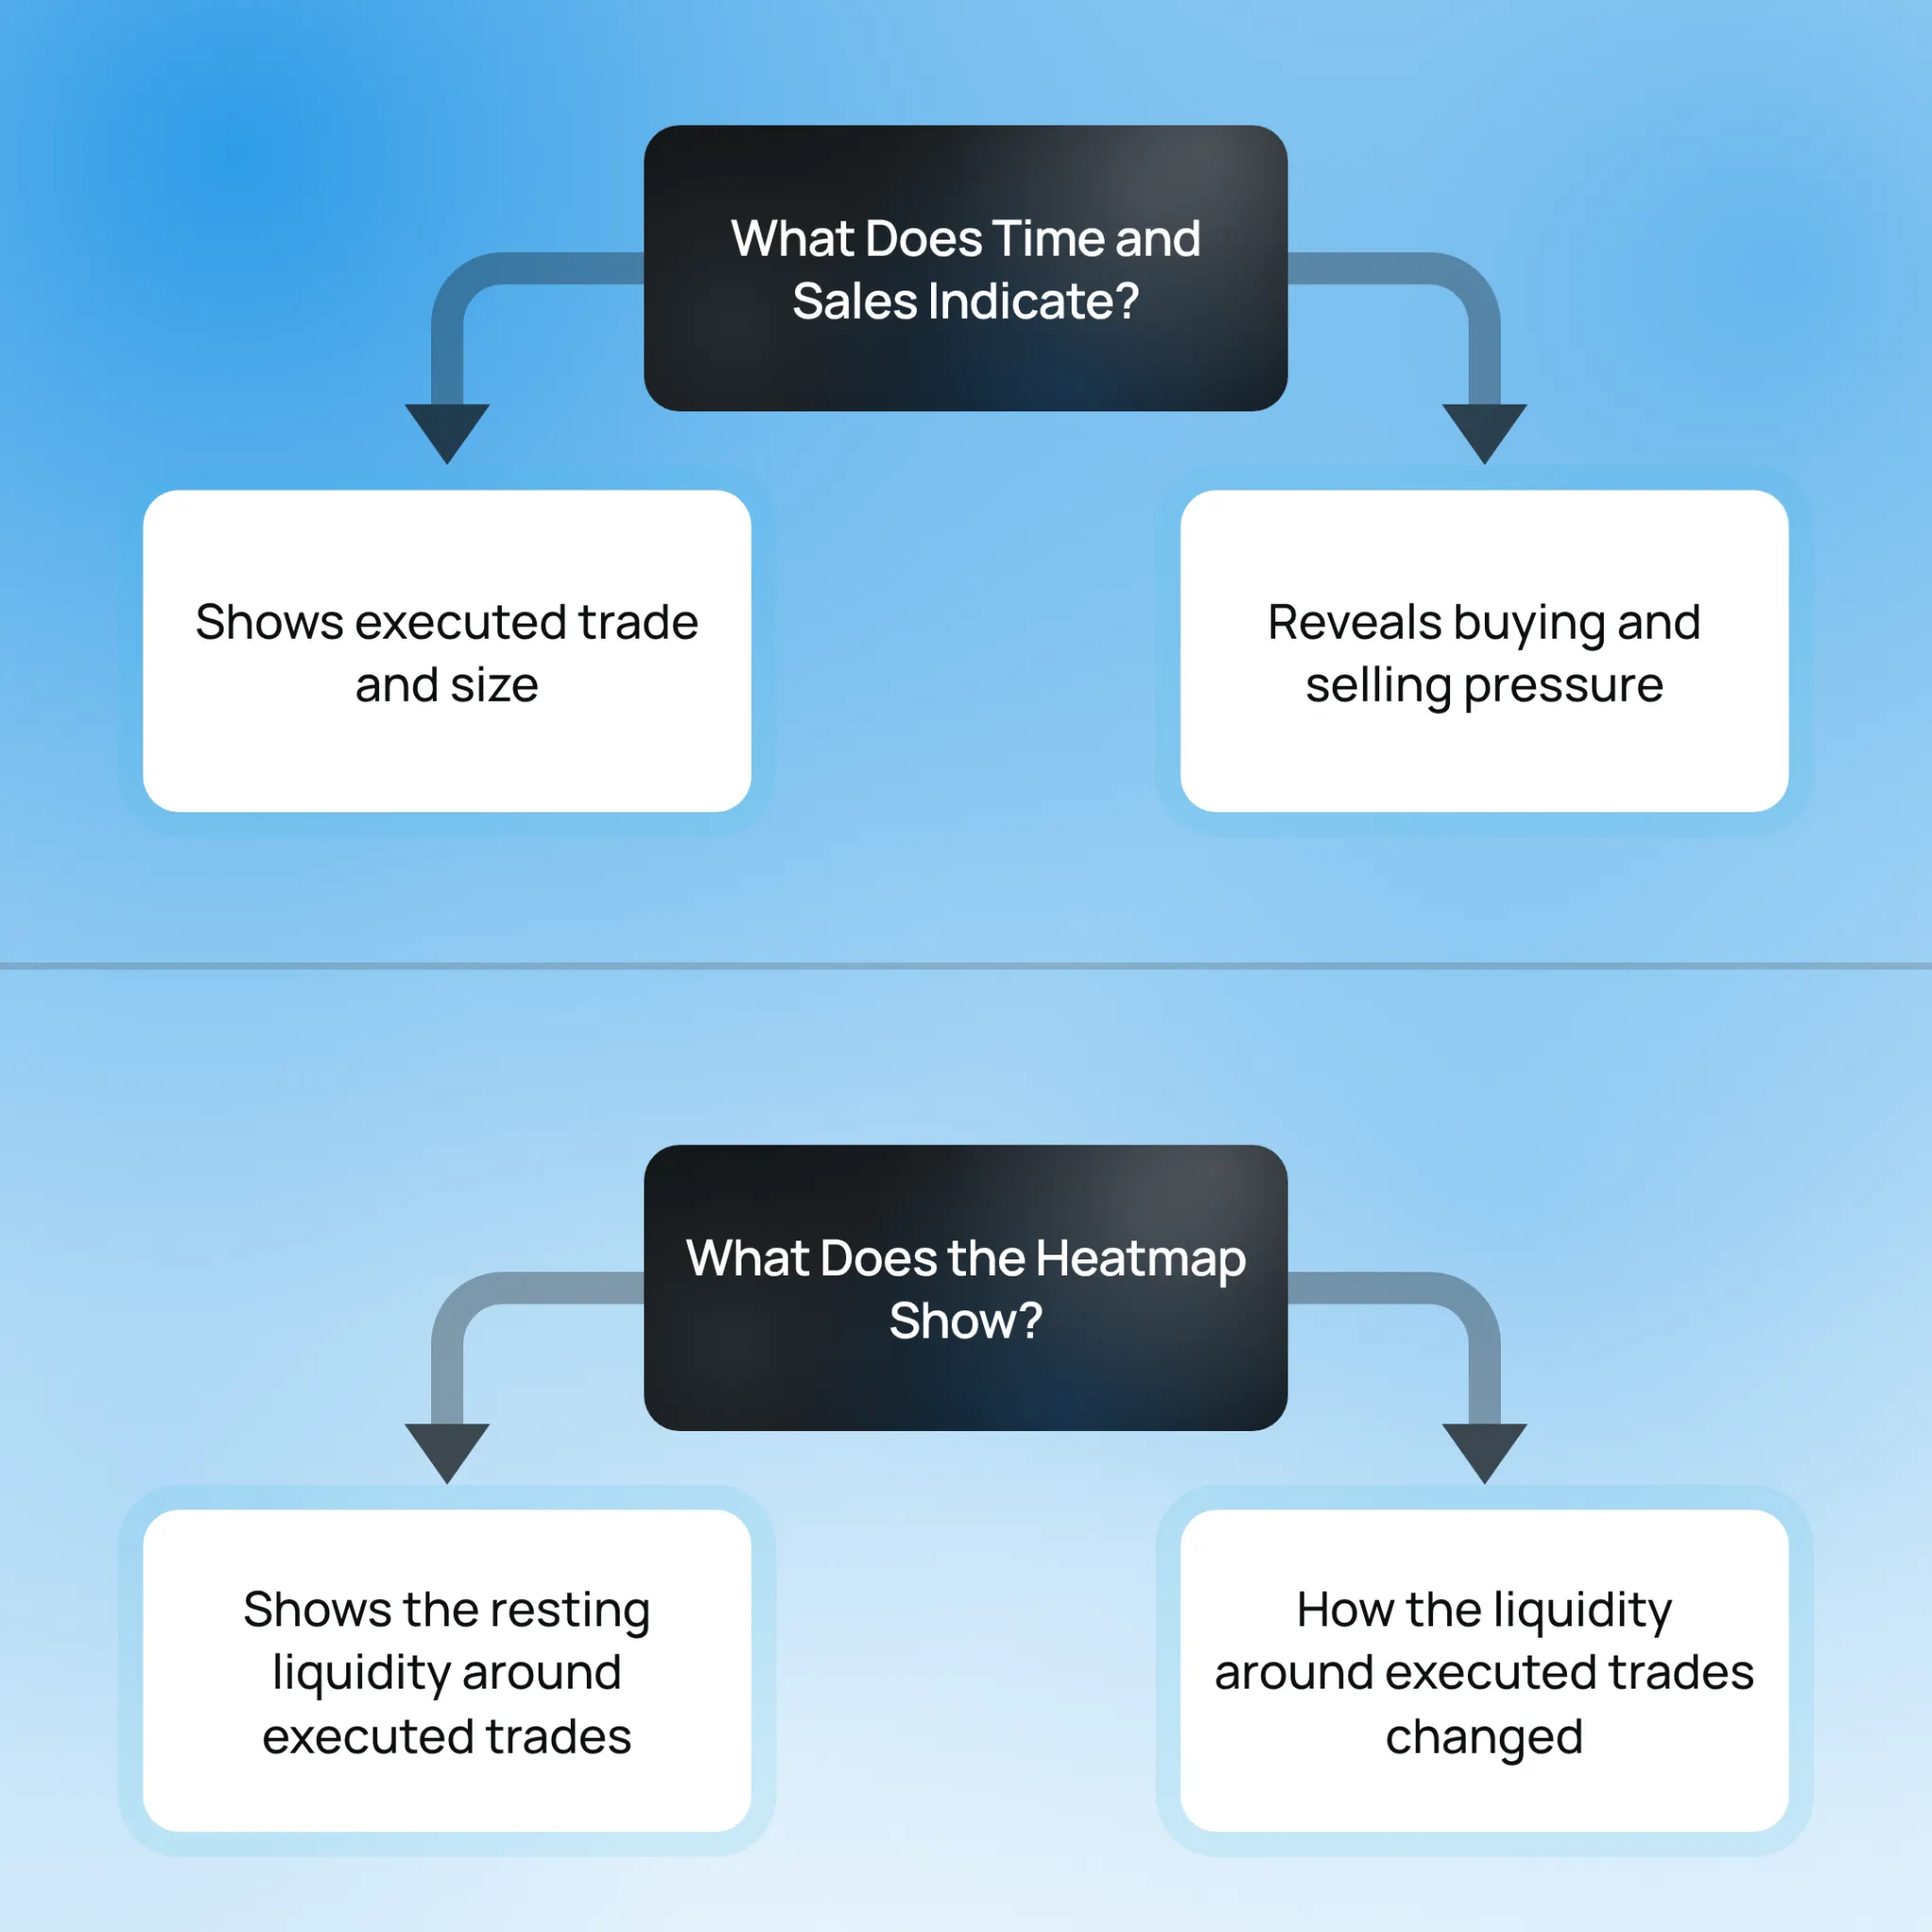
To gain more clarity, consider this practical example:
- Suppose a series of large prints at the offer shows aggressive buying through time and sales trading.
- The heatmap simultaneously shows a large resting sell order being consumed at that price.
- Now, the two views together reveal that aggressive buying is meeting available supply.
This provides more information than seeing the large prints alone because the heatmap shows what was available to absorb those trades.
A Common Mistake: Treating Tape Speed as the Whole Story
A common tape reading mistake is assuming a fast stream of prints guarantees a sustainable breakout. High tape speed shows increased trading activity, but it does not reveal whether the incoming orders are being absorbed by resting liquidity.
For example,
- A sudden burst of buying prints may make the market appear strongly bullish.
- However, if a large sell order remains at the same price on the heatmap and absorbs those trades, price may fail to advance.
- The tape shows intense activity, but the heatmap reveals the underlying resistance.
Therefore, fast prints without follow-through can tell a different story from fast prints accompanied by price movement. This is where combining time and sales with a heatmap adds context to order flow. It may also help distinguish high trading activity from actual movement through available liquidity.
Building a Habit of Reading Both
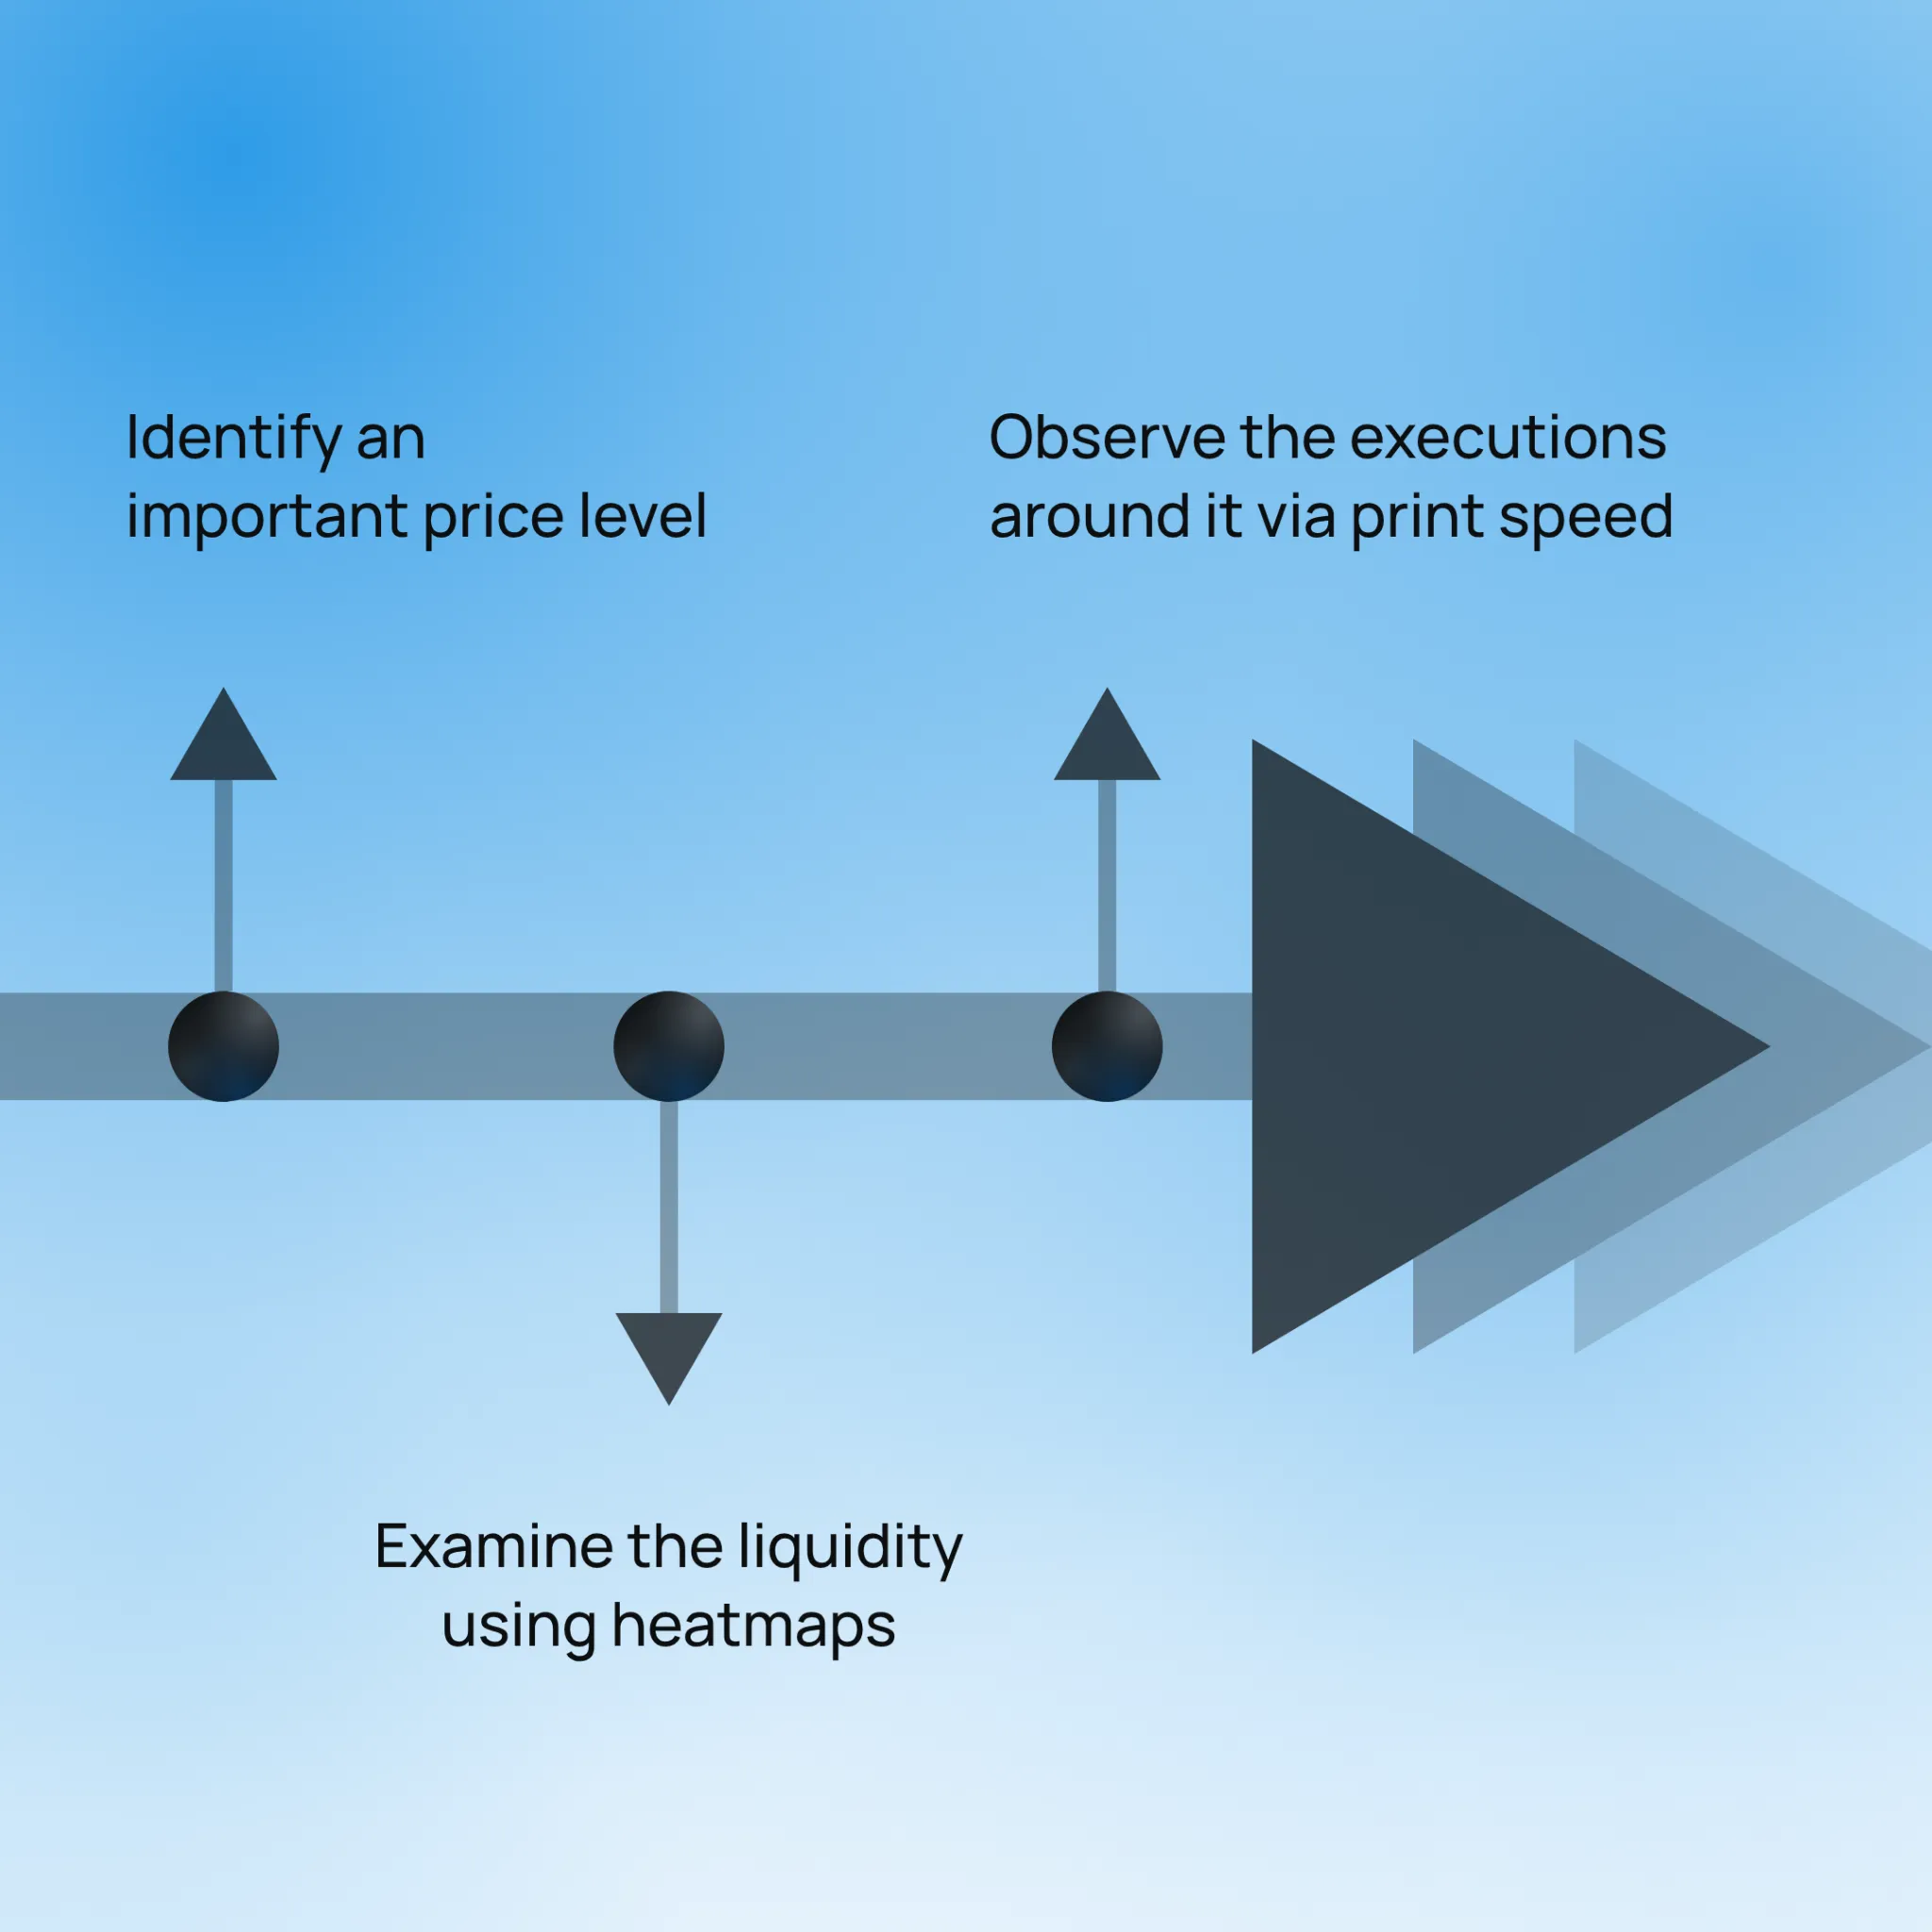
Firstly, a level of interest can be identified, such as:
- Prior high or low
- Support area, or
- Resistance area.
Next, the heatmap can be checked for resting liquidity around that level. Using it, market participants may observe where buy or sell orders are available.
Once that liquidity is identified, time and sales can show what happens as price approaches it. A stream of larger prints at the offer or bid may indicate that aggressive orders are testing the resting liquidity. In contrast, a slower sequence of smaller trades may show that price is approaching the level without strong execution pressure.
Seeing Both Views in One Place
Reading both views can create friction because the time and sales window and market-depth display are usually separate. A trader may need to switch between the tape and a depth view, then mentally match the trades in one window with the liquidity shown in another.
Bookmap brings these two types of information into the same visual space. Executed volume appears alongside a historical view of resting liquidity. This allows the sequence of trades to be examined alongside the orders available around those trades.
This does not eliminate the need to read the tape. Through a combined analysis made on Bookmap, traders can find answers to these two important questions:
- The tape answers “What traded?”, and
- The heatmap answers “What was resting there, and how did that liquidity behave?”
Seeing both in the same market view makes it easier to connect execution with the liquidity environment in which it occurred.
Conclusion
Time and sales and a heatmap provide two different views of the same market. The tape records completed trades. It shows the price, size, timing, and pace of executions. On the other hand, the heatmap adds the surrounding liquidity. It shows where resting orders were available and how those orders changed as the market moved.
Therefore, neither tool replaces the other. A burst of prints may show aggressive activity, but the heatmap can reveal whether that activity is moving through thin liquidity or being absorbed by larger orders.
Together, these views provide greater context for order flow and reading the tape. Good trading decisions start with better evidence. See how Bookmap helps traders observe liquidity and order flow in real time.
FAQs
1. What is the difference between time and sales and a heatmap?
Time and sales is a scrolling record of executed trades. It shows several details, such as:
- The execution time,
- Price,
- Trade size, and
- Whether the trade occurred at the bid or offer.
A heatmap shows resting liquidity across price levels over time. It can also display executed volume on top of that liquidity. Such a display gives a spatial view of how the order book changes as trades occur.
2. Is a heatmap better than time and sales?
Neither tool replaces the other because each shows different market information. Time and sales confirms what actually traded and shows the sequence, size, and pace of executions.
In contrast, a heatmap shows the liquidity surrounding those trades and how resting orders are added, removed, or consumed. Using both can provide a more complete view of order flow than using either source alone.
3. Can order flow be read without a heatmap?
Yes, Time and sales alone are a form of order flow analysis and have been used in trading for decades. The tape shows executed trades, including their price, size, timing, and direction.
However, it does not show resting orders that have not traded. A heatmap adds that missing layer by showing available liquidity across price levels and how that liquidity changes over time.
4. What does it mean when the tape is fast but price does not move?
A fast tape with little price movement usually indicates that aggressive orders are being absorbed by resting liquidity at a particular price level. For example,
- Repeated buying at the offer may occur without pushing price higher.
- That’s because sell orders continue to absorb those trades.
In such cases, a heatmap can provide additional evidence by showing the resting order at that level and how its size changes as trades occur.
5. Do beginners need both time and sales and a heatmap?
Beginners can start by learning either time and sales or a heatmap, since each introduces a different part of market behavior. However, combining both views can provide a broader picture of order flow.
Time and sales shows completed transactions, while the heatmap shows the liquidity surrounding them. Additionally, studying both can also help distinguish active trading from liquidity that absorbs those transactions.
 Twitter
 Facebook