Using MBO Data to Uncover Hidden Market Orders: A Trader’s Secret Weapon
Information is power. It allows you to predict the future. This famous quote perfectly applies to financial markets. Having access to key information, such as market trends and order flow, enables you to seize profitable opportunities before others do.
But where can you find this key information? Ever heard about MBO (Market-by-Order) data?
Yes, MBO is the true source of your key information. It provides a detailed view of every order in the market and exposes hidden market orders. For example, using it, you can see when large institutions are building positions.
In this article, we will explore the intricacies of MBO data. We will compare it to Market-by-Price (MBP) data and highlight its advantages. Next, we will explain to you the various tools within the MBO Bundle, such as the Stops & Icebergs sub-chart, Liquidity Tracker Pro, and Tradermap Pro. By understanding these concepts, you will learn how to spot hidden market orders and even anticipate price movements before others. Let’s begin.
What is MBO Data?
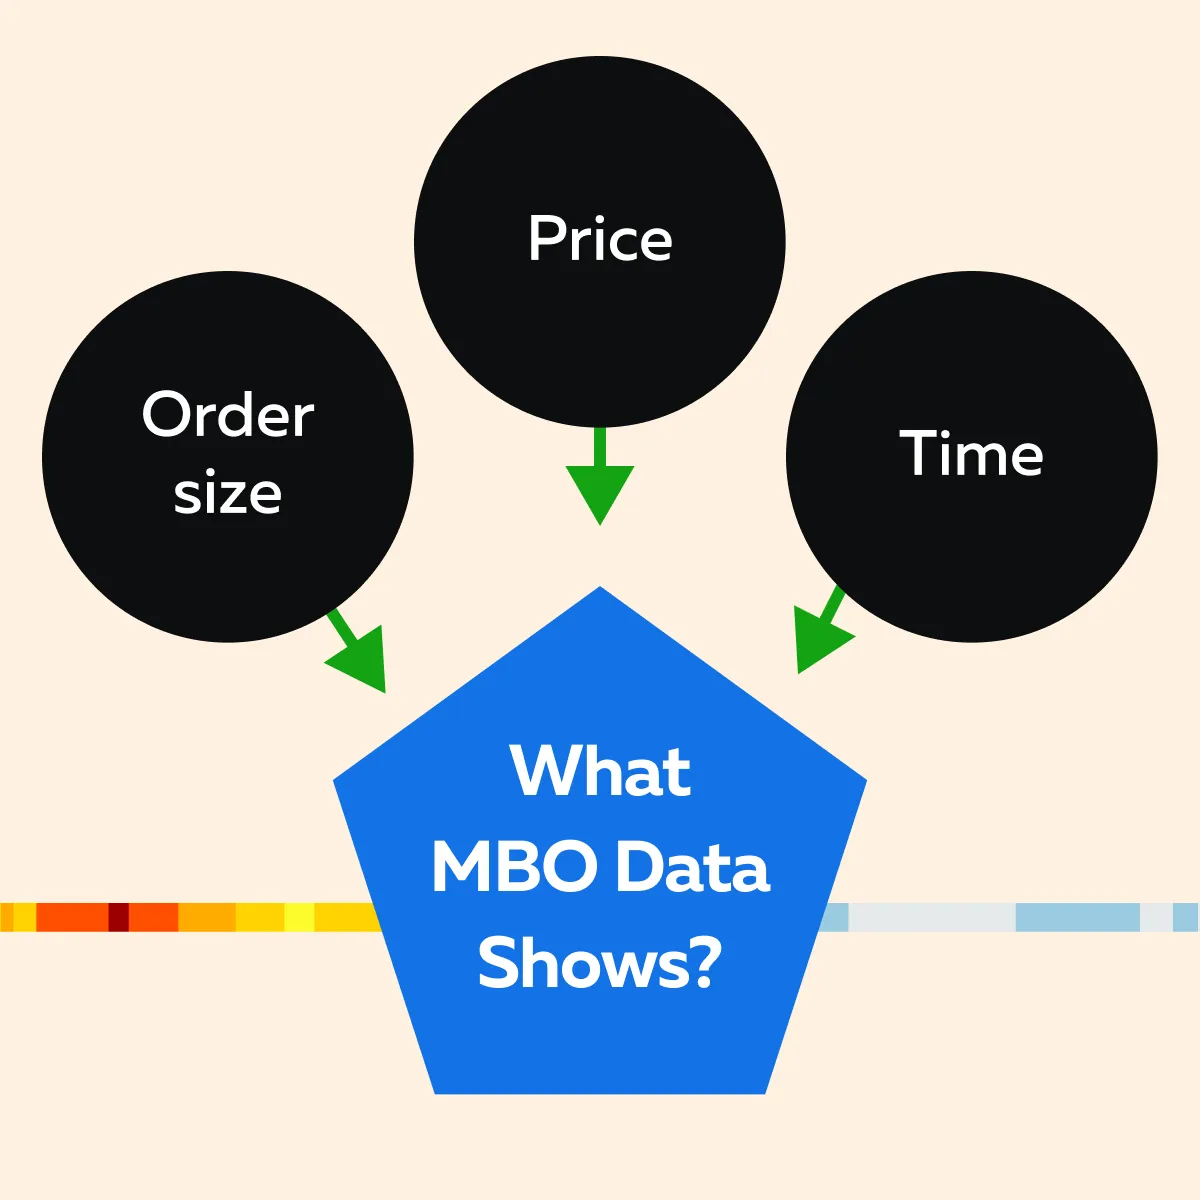
MBO (Market by Order) data offers traders a deeper view of market activity and depth. It provides insights related to each individual order in the market. This allows them to track market trends in real-time. Check the graphic below to see what all the information it includes:
For more clarity, let’s study an example related to practical usage of MBO Data:
- Say a trader analyzes MBO data in the futures market.
- They notice several small buy orders being placed consistently at different prices.
- However, despite this placement, the total volume of these orders appears unusually large.
- The trader recognizes this pattern as an iceberg order.
- Realizing this, the trader decides to front-run the price by placing their own buy order before the large institutional order gets fully executed.
- The market price is driven higher as the substantial buy order is being executed.
- This allows the trader to profit by selling at a higher price.
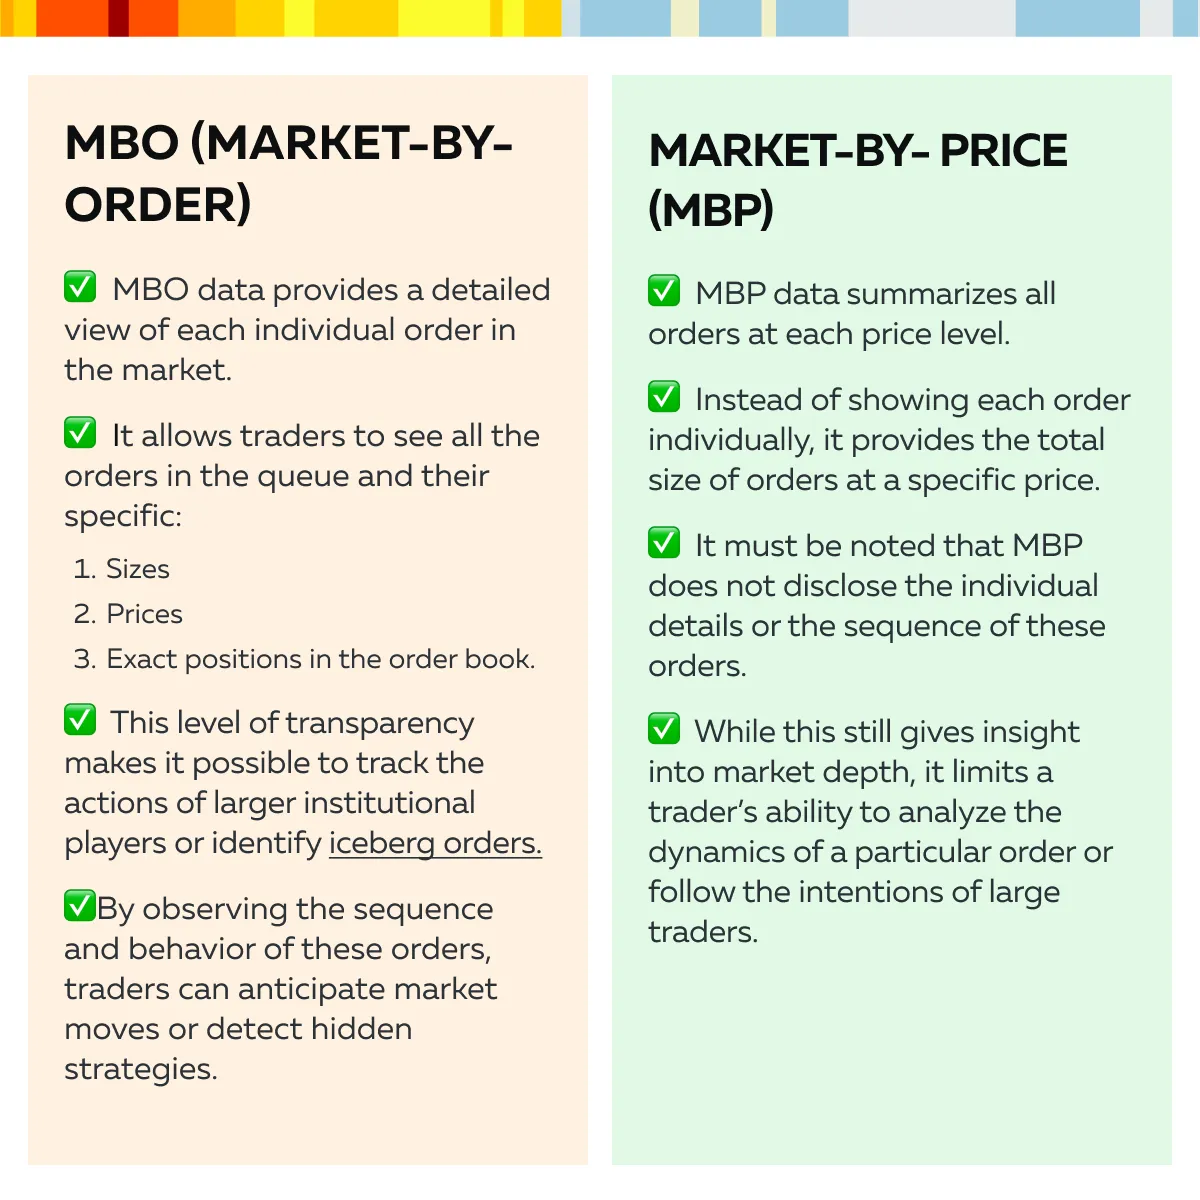
Market-by-Order (MBO) vs. Market-by-Price (MBP)
Supported Connections for MBO Data on Bookmap
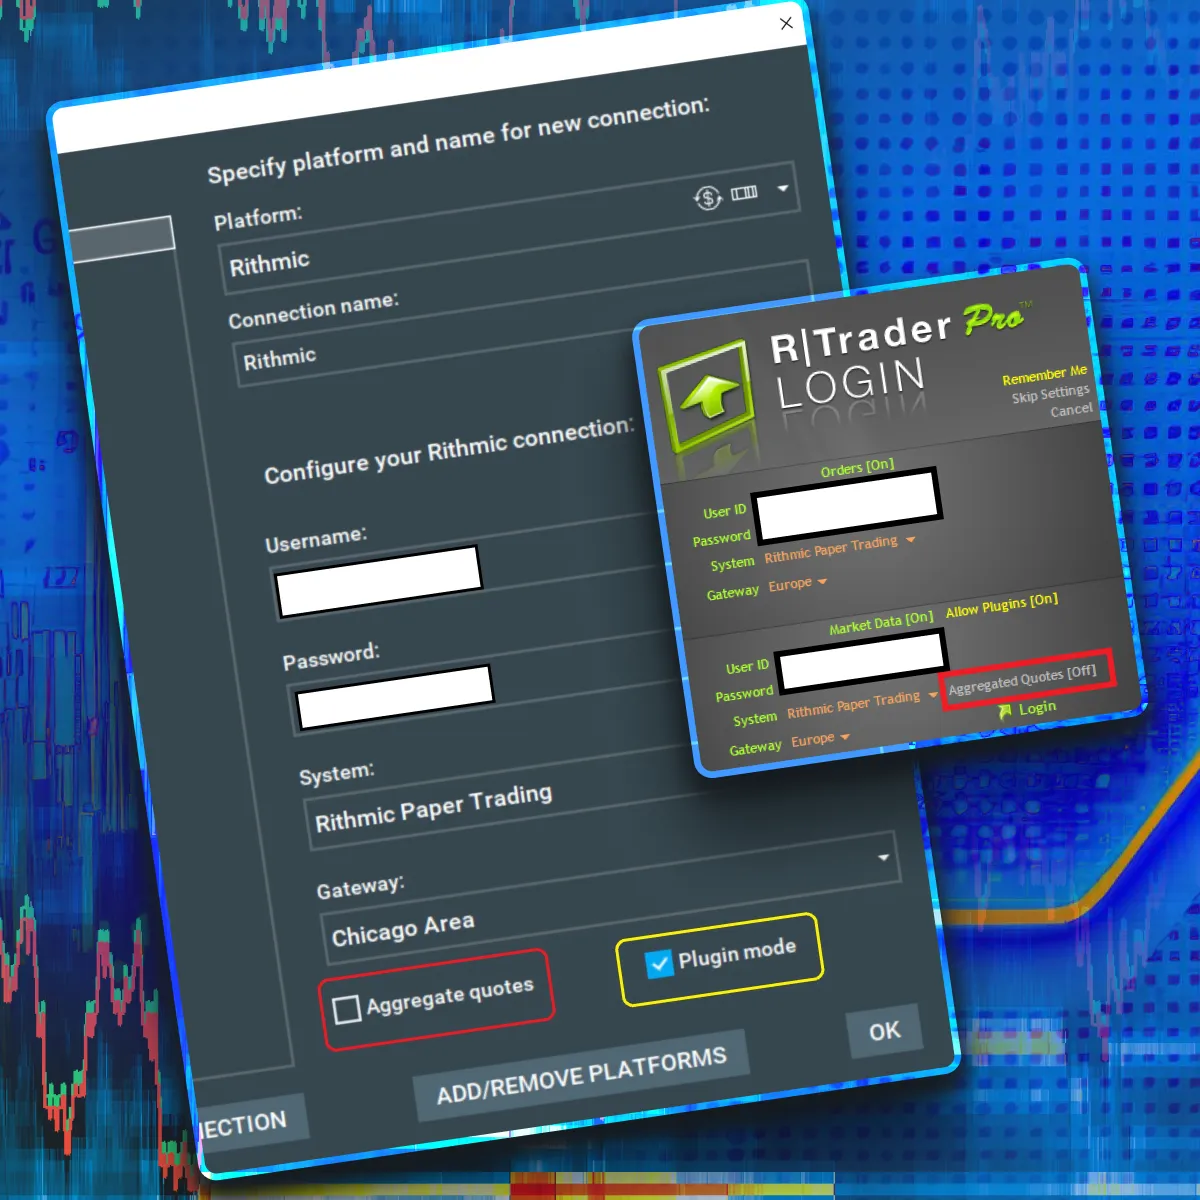
Our Bookmap offers support for MBO data from various providers, giving you a competitive advantage.
These platforms provide extensive market order information and make MBO data accessible to traders. It is worth mentioning that access to MBO data from these providers is important for traders because it reveals the true order flow in the market. By observing each individual order, traders can identify hidden:
- Trends,
- Patterns,
- Anomalies.
This insight allows them to make well-informed trading decisions based on the market’s current state. Let’s consider an example:
- A futures trader uses Rithmic to access MBO data.
- They identify an iceberg order.
- By noticing this, the trader places their own order before the large institutional order is fully executed.
- By doing so, they take advantage of the upcoming price movement.
The MBO Bundle by Bookmap: Tools to Uncover Hidden Orders

Our Bookmap’s MBO Bundle provides access to several powerful add-ons. These add-ons allow traders to take full advantage of MBO data. Let’s check out each tool below and see how it can help you uncover hidden orders:
- Stops & Icebergs (SI) Sub-Chart

The Stops & Icebergs (SI) sub-chart is a powerful add-on tool. It visualizes the execution of stop orders and iceberg orders in the market. Moreover, traders using it gain critical insights into market behavior that aren’t visible through traditional price charts. By showing the locations where these significant orders occur, traders gain a deeper understanding of the exact forces driving the price movement.
Now, let’s see how it works:
| Parameters | Stops | Icebergs |
| What do they mean? |
|
|
| How does the SI sub-chart help? |
|
|
Let’s understand better through an example:
- Say a trader is watching the SI sub-chart.
- They notice a buildup of iceberg orders absorbing aggressive buying at a key support level.
- This means that a large seller is:
- Continuously placing hidden sell orders,
and
- Preventing the price from rising.
- This pattern suggests that the aggressive buyers might soon run out of momentum.
- Eventually, this situation will lead to a potential reversal.
- The trader uses this information to anticipate a price drop and plans a short trade accordingly.
- Stops & Icebergs (SI) On-Chart

The Stops & Icebergs (SI) On-Chart tool displays iceberg and stop orders directly on the main Bookmap chart. They give traders real-time visual cues of significant market activity. Instead of relying solely on sub-charts or external data, this tool integrates key order flow information into the main chart. By referring to this chart, traders get a clear and immediate view of the likely market reactions.
Now, let’s talk about how it actually works. The SI On-Chart tool detects when these hidden/ iceberg orders are placed or executed. Then, it marks them directly on the price chart. A trader analyzing this chart easily spots key support and resistance areas where large institutions are placing trades. Similarly, stop orders are shown on the chart and visually represented.
Let’s understand better through an example:
- Say a trader is using the SI On-Chart tool.
- They notice iceberg orders starting to accumulate at a resistance level.
- This signals that large sellers are entering the market.
- They are preparing to prevent further upward movement.
- Based on this insight, the trader decides to enter a short position.
Gain an edge by using Stops & Icebergs to uncover hidden market movements. Click here to explore the full MBO Bundle.
- Liquidity Tracker Pro (LT Pro)
Liquidity Tracker Pro (LT Pro) provides traders with a comprehensive view of the market.
This tool visualizes how liquidity changes over time and allows traders to spot patterns and trends. Also, most traders using this tool can easily determine the expected turning points based on liquidity shifts.
Now, let’s see how it works:
| Historical and Real-Time Liquidity | Liquidity Shifts |
|
|
Let’s understand better through an example:
- Say a trader is watching LT Pro.
- They notice liquidity drying up on the sell (ask) side at a particular price point.
- This disappearing liquidity signals that:
- Large buyers are stepping in,
- and
- They are absorbing all available sell orders.
- Such a situation will lead to an upward price movement.
- By recognizing this early, the trader decides to place a buy order.
- Tradermap Pro
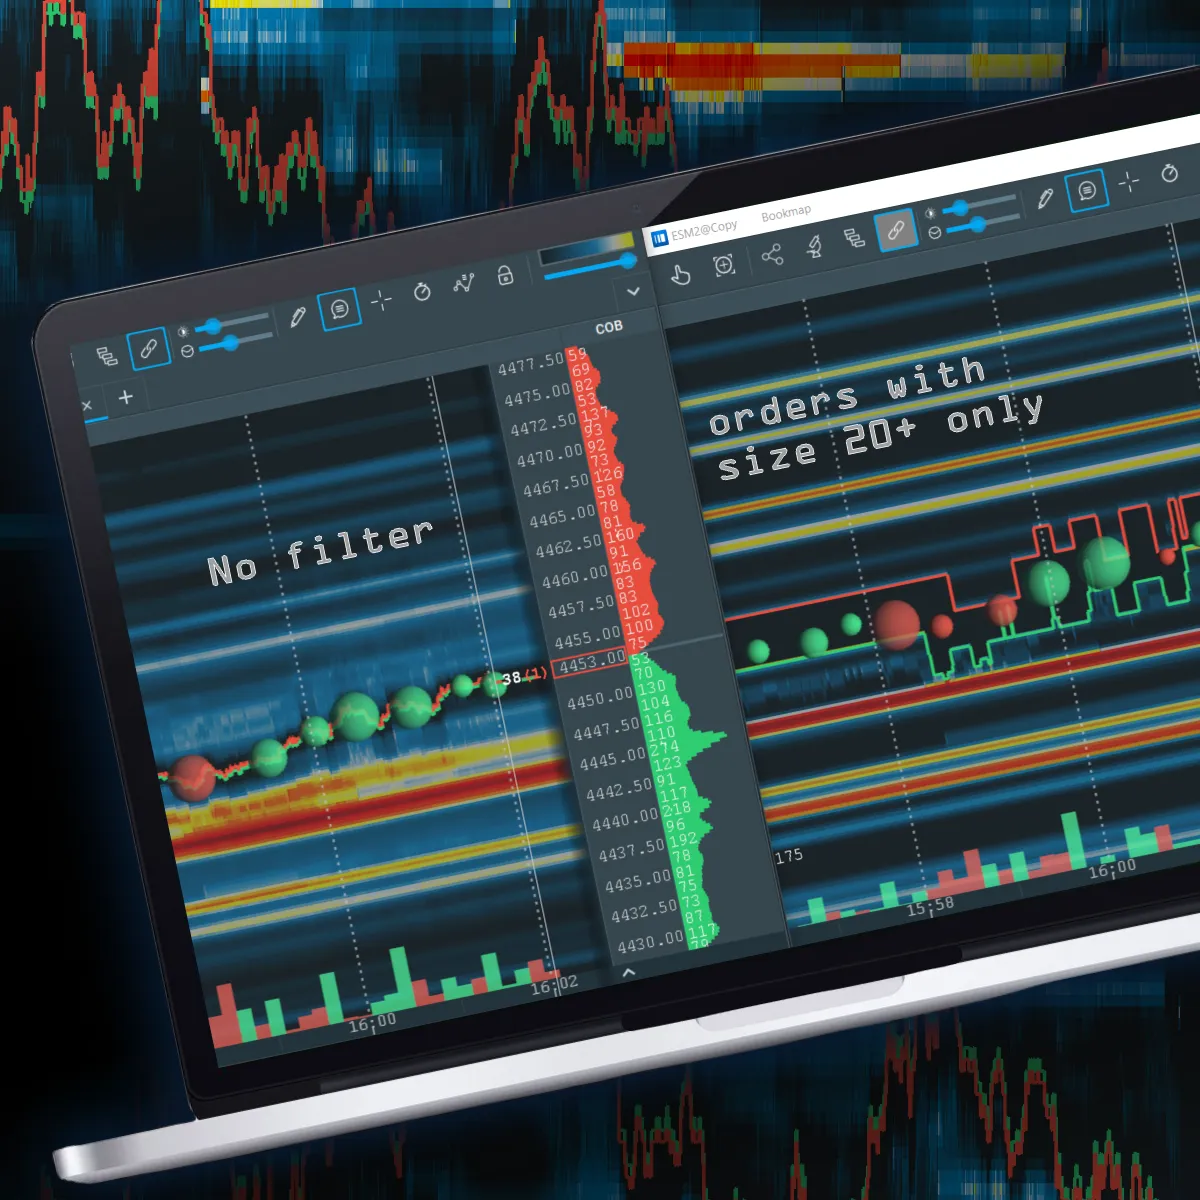
Tradermap Pro is an advanced add-on that enables traders to create custom heatmaps to visualize market liquidity based on MBO (Market-by-Order) data. Using it, traders can filter and focus on specific types of orders or liquidity. The information so gained helps traders to monitor hidden liquidity or large orders. Moreover, traders can even customize their views to track the behavior of large players in the market, allowing them to follow the “smart money.”
Now, let us specifically talk about hidden liquidity. Please note that large market participants often hide their true intentions by using iceberg orders. Sometimes, they do so by spreading their trades across various price levels.
In such situations, Tradermap Pro can easily reveal these hidden layers of liquidity. On it, traders can see where large orders are accumulating or dispersing. This helps in anticipating significant market movements.
Let’s understand better through an example:
- Say a trader is using Tradermap Pro.
- They set up a custom heatmap that only displays large orders.
- This allows them to track institutional buying and selling in real-time.
- They follow the movement of these large orders.
- They notice an accumulation of buy orders at a particular level.
- Consequently, the trader decides to enter a long position.
- Market Pulse Bundle
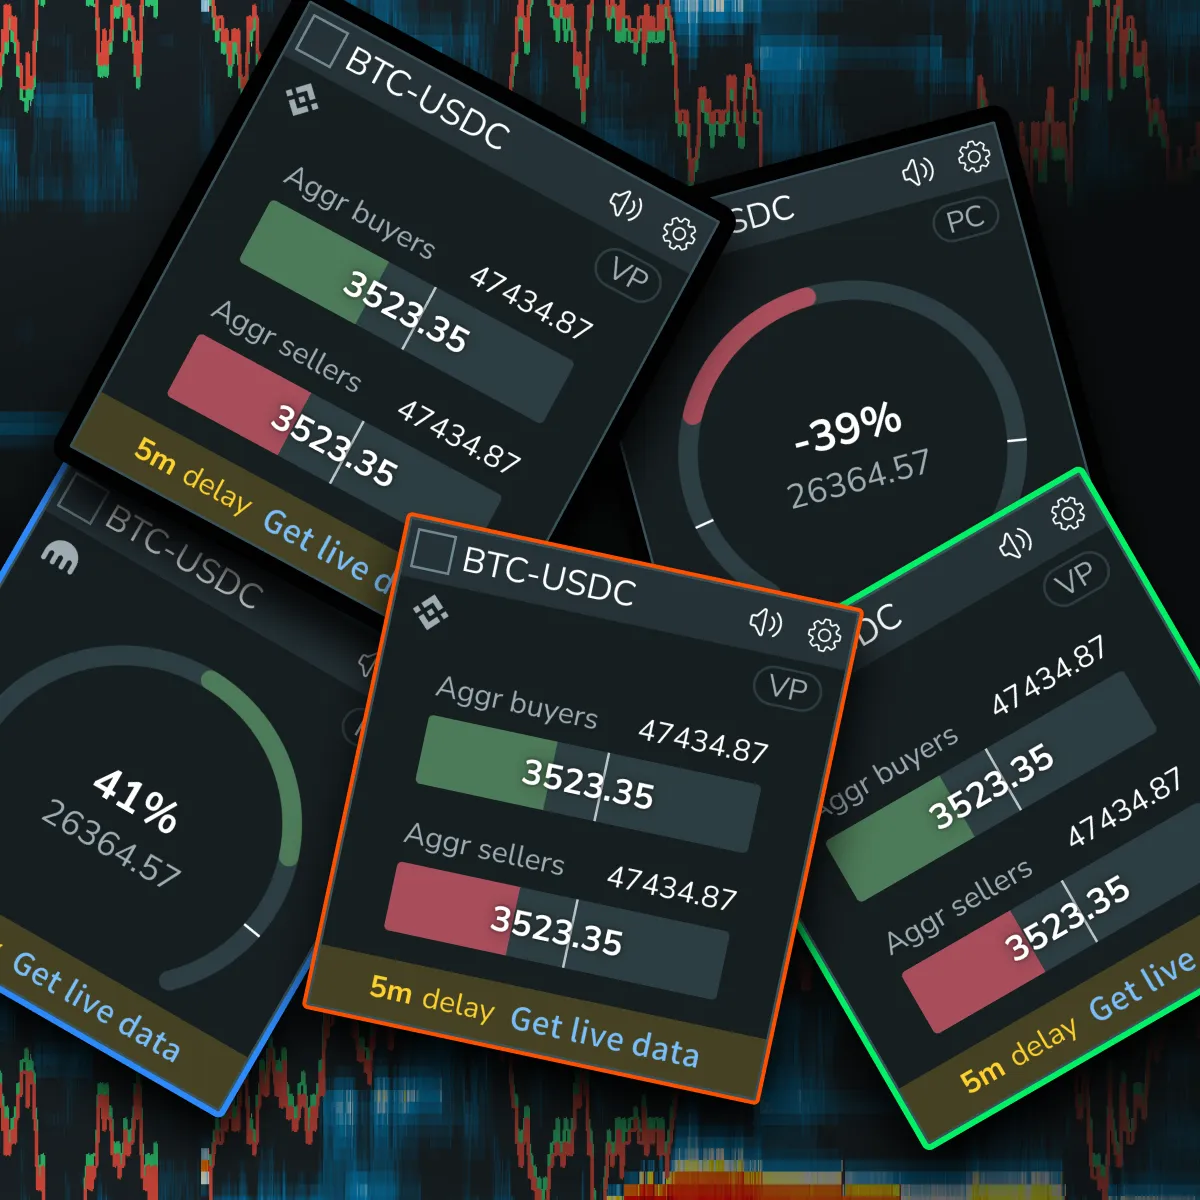
The Market Pulse Bundle is a collection of widgets that provides traders with a real-time and comprehensive view of various market events.
By integrating multiple data streams into one platform, this tool allows traders to track market dynamics across different assets simultaneously.
Now, let’s understand its practical usage:
| Order Flow and Liquidity Changes | Order Book Shifts |
|
|
Let’s understand better through an example:
- Say a trader is using the Market Pulse Bundle.
- Using it, they monitor liquidity changes across multiple financial instruments, such as futures contracts and currencies.
- The trader notices that liquidity is rapidly decreasing in one instrument.
- Simultaneously, another related asset shows increasing liquidity.
- The trader recognizes this as an opportunity for “cross-asset arbitrage.”
- They try to profit from price differences between two correlated assets.
- The trader enters offsetting positions in both markets.
- By doing so, they aim to capture the price discrepancy before it is corrected.
Explore the full MBO Bundle here and save 25%!
Why MBO Data Provides a Competitive Advantage
MBO (Market-by-Order) data provides a granular view of every individual order. It is different from traditional data, which simply combines orders. This in-depth perspective helps traders identify hidden market trends. For example, a large institution uses iceberg orders to build positions discreetly. By revealing these actions, MBO data provides deeper insights into market dynamics, enabling traders to respond more strategically.
For a better understanding, let’s study an example:
- Say a trader is using MBO data.
- They notice a pattern of small buy orders.
- These orders are accumulating at a particular price level.
- The trader recognizes this as an iceberg order.
- These orders are placed by a large institution that is slowly building a significant position without alerting other market participants.
- Using this information, the trader positions themselves to capitalize on the institution’s eventual impact on the market.
Thus, we can state that traders can expose these hidden moves by using MBO data. Additionally, they can spot early trends and even react before major price shifts.
Conclusion
MBO data provides significant advantages for traders. It gives a detailed view of every individual order in the market and allows them to identify hidden market activities. This information helps traders to anticipate future price movements and gives them a clear understanding of market dynamics.
To optimize your trading skills, our Bookmap’s MBO Bundle offers several add-ons. Some popular tools are Stops & Icebergs sub-charts, Liquidity Tracker Pro, and Tradermap Pro. These add-ons significantly enhance any traders’ ability to first visualize and then analyze real-time order flow, showing where liquidity is building or disappearing.
By using our Bookmap, traders can gain a competitive edge, uncover hidden orders, and better understand market sentiment. Unlock the power of MBO data and get 25% off the MBO Bundle by Bookmap!
 Twitter
 Facebook